May 20, 2019
Chickamin Glacier, Alaska Retreat Generates Separation and Lake Expansion
Posted by Mauri Pelto
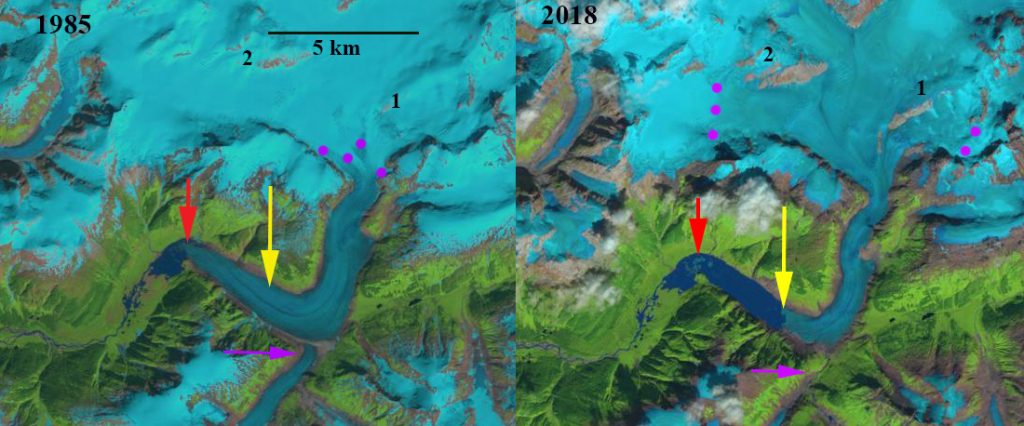
Chickamin Glacier, Alaska in 1985 and 2018 Landsat images indicating the 3.5 km retreat and associated lake expansion. Red arrow is 1985 terminus location, yellow arrow is the 2018 terminus location, pink arrow is former junction area with Through Glacier. The purple dots indicate the snowline. Point 1 and 2 are locations of bedrock expansion above the equilibrium line altitude.
Chickamin Glacier in southeast Alaska glacier drains south from an icefield near Portland Canal and straddling the border with British Columbia. The glacier ended on an outwash plain in 1955 at an elevation of 250 meters. Shortly thereafter a lake began to form, and by 1979 a Landsat image indicates a lake that is 1300 meters long and a retreat of ~2.5 km from 1902-1979 (Molnia, 2008). The glacier at that time was fed by a substantial tributary entering from the south ~5 km above the terminus, Through Glacier-pink arrow. Here we examine Landsat images from 1985-2018 to identify the response to climate change.
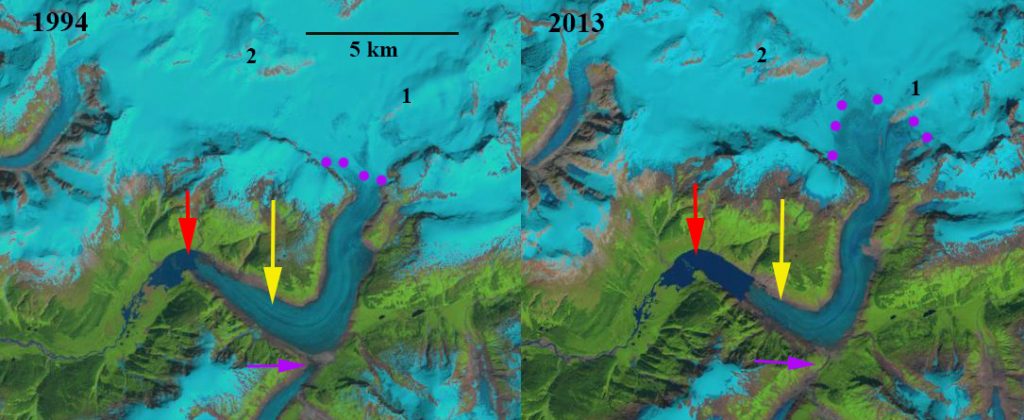
In 1985 the glacier terminated at an elbow in the lake where the lake both narrows temporarily and turns east, red arrow. The glacier had terminated close to this location for 30 years. The snowline is at 1150 m, and Through Glacier still connects to Chickamin Glacier. At point 1 and 2 the area of exposed bedrock is limited. In 1994, the glacier has retreated 500 m from the elbow. Through Glacier has separated from Chickamin Glacier. The snowline in 1994 is at 1125 m. In 2013, Through Glacier has retreated 1600 m from Chickamin Glacier. Chickamin Glacier has retreated 2 km since 1985 and the snowline is at 1250 m. By 2018 Chickamin Glacier has retreated 3.5 km since 1985 a rate of just over ~100 m/year, yellow arrow. The terminus is currently at a point where the lake narrows, which should reduce the retreat rate. In 2018, the snowline reached 1525 m, leaving only 10-15% of the glacier in the accumulation zone. The exceptionally high snowline in 2018 was also noted at Taku Glacier. The snowline from 2014-2018 has persistently been above 1350 m, which indicates substantial negative mass balance for the glacier that will drive continued retreat. The persistent snowline elevation above 1250 m is indicated by the expansion of bedrock areas at Point 1 and 2 from 1985 to 2018, which both are located in what was the typical accumulation zone prior to that time.
The sustained mass balance losses follow that of Lemon Creek Glacier, which has a a long term record from 1953-2018 indicating a loss of ~-0.5 m/year (Pelto et al. 2013). The retreat and lake expansion has become a chorus with more than 20 coastal Alaskan glaciers having at least a 2 km lake expansion due to retreat since 1984, documented individually in previous posts at this blog.
Chickamin Glacier, Alaska in 1994 and 2013 Landsat images indicating the 3.5 retreat and associated lake expansion. Red arrow is 1985 terminus location, yellow arrow is the 2018 terminus location, pink arrow is former junction area with Through Glacier. The purple dots indicate the snowline. Point 1 and 2 are locations of bedrock expansion above the equilibrium line altitude.
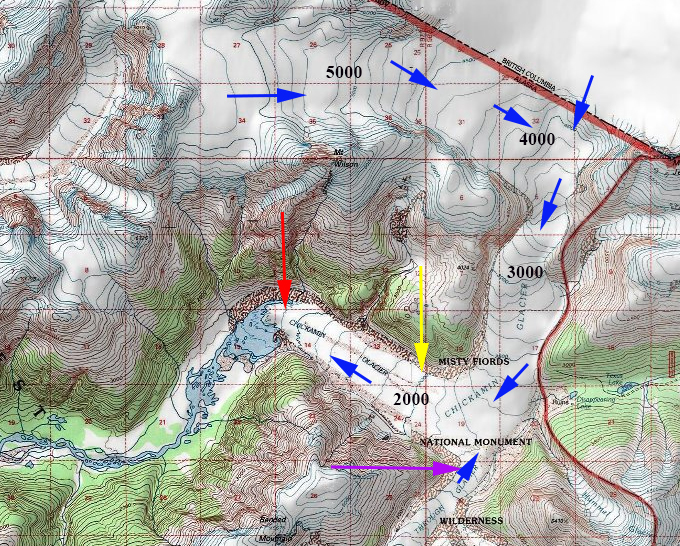
USGS map of Chickamin Glacier based on 1948 aerial photographs


 Dean of Academic Affairs at Nichols College and Professor of Environmental Science at Nichols College in Massachusetts since 1989. Glaciologist directing the North Cascade Glacier Climate Project since 1984. This project monitors the mass balance and behavior of more glaciers than any other in North America.