
April 15, 2019
Northern Patagonia Icefield High Equilibrium Line Altitude in 2019
Posted by Mauri Pelto

Northern Patagonia Icefield Landsat view on 4/6/2019. Transient snowline indicated on individual glaciers with purple dots. Clockwise, L=Leones, So=Soler, N=Nef, Ca=Cachet, Co=Colonia, PN=Pared Nord, PS=Pared Sur, H4=HPN4, St=Steffen, A=Acodado, B=Benito, H1=HPN1, Sq=San Quintin.
The Northern Patagonia Icefield from 1987-2015 decreased in area, while debris cover area expanded and the size of proglacial lakes expanded (Glasser et al 2016). The icefield area declined from 4113 to 3887 km2, debris cover increased from 168 to 307 km2 and lake area expanded from 112 to 198 km2 In this paper we also examined the recent rise in the transient snow line (TSL). The TSL is the location of the transition from snow cover to bare glacier ice at a particular time during the ablation season, while the Equilibrium Line Altitude (ELA) is the altitude of the snow line at the end of the ablation season. The TSL at the end of the melt season is the ELA. In recent years the ELA has been rising, and the highest annually observed TSL in the period 2013-2016 averaged 1215 m (Glasser et al 2016). This is an ELA rise of at least 103 m compared with the observed 1979-2003 ELA. Landsat 8 imagery from April 6, 2019 reveals the TSL for most NPI glaciers, this is typically beyond the end of the melt season, but not in 2019, hence the TSL from this date will be the approximate annual ELA. How does it compare and what does that mean for icefield mass balance in 2019?
On April 6, 2019 the TSL was highest on glaciers on the east side of the icefield decreasing for the western outlet glaciers. Clockwise from Leones Glacier in the Northeast to San Quintin Glacier on the west side the TSL observed ranged from 1525 m on Leones Glacier and Soler Glacier to a low of 1075 m on San Quintin Glacier. The mean TSL is 1260 m for the glaciers reported by Glasser et al (2016) and 1300 m for all glaciers. TSL on April 6, 2019 on glaciers on the east side of the icefield averaged 1425 m, while on the east side of the icefield the average was 1200 m.
Willis et al (2012) noted the ELA of NPI glaciers for the 2001-2011 period, a glacier by glacier comparison to 2019 indicates the ELA is ~150 m higher in 2019. This is the highest mean TSL observed for the NPI and suggests a strong negative surface mass balance year for the icefield in 2019. This does not include the calving losses such as observed at San Quintin Glacier. Dussaillant et al (2018) reported negative mass balances of NPI glaciers of ~-1 m using two different methods for the 2000-2012 period. TSL observations since indicate the ELA has been higher in recent years driving even more negative balances. As Pelto (2017) noted 19 of the 24 main outlet glaciers of the Northern Patagonia Icefield ended in a lake in 2015, all the lake termini retreated significantly in part because of calving losses. Surface mass balance losses in 2019 will lead to continued retreat such as observed at San Quintin Glacier, Nef Glacier, and Acodado Glacier. This will also increase the debris covered area, which increases albedo and ablation further.
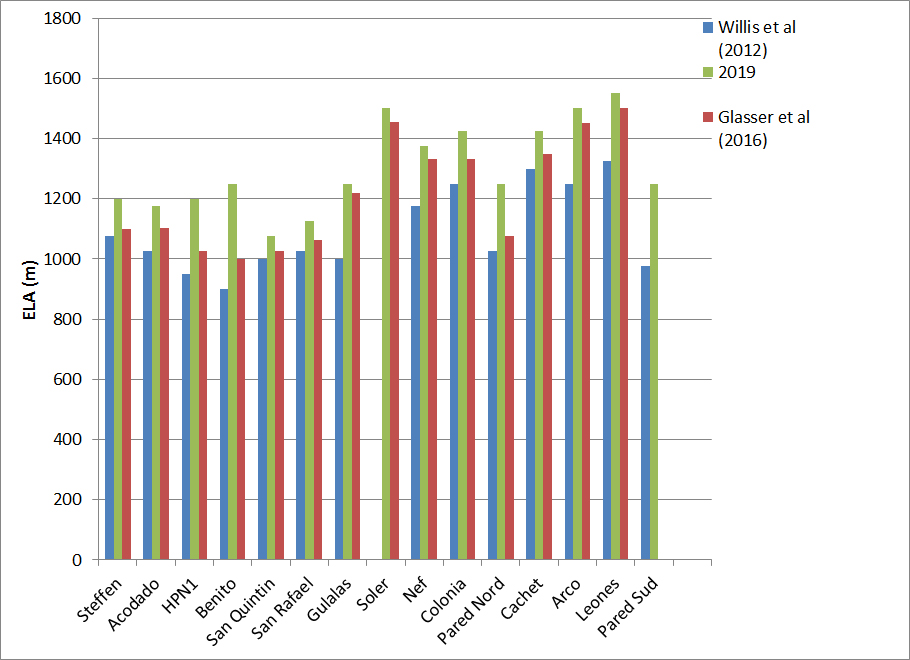
Northern Patagonia Icefield ELA reported by Willis et al (2012), Glasser et al (2016) and for 2019.

Gualas Glacier (G) and Reichert Glacier (R) TSL on 4/6/2019 in Landsat image.
 Dean of Academic Affairs at Nichols College and Professor of Environmental Science at Nichols College in Massachusetts since 1989. Glaciologist directing the North Cascade Glacier Climate Project since 1984. This project monitors the mass balance and behavior of more glaciers than any other in North America.