
December 13, 2018
AGU Poster Hall-Cryosphere Perspectives
Posted by Mauri Pelto
The American Geophysical Union Fall meeting’s Cryosphere section continues to grow as seen in the Poster hall. The poster hall is where most of the research is presented and is dominated by student work. Here are some examples of this work.
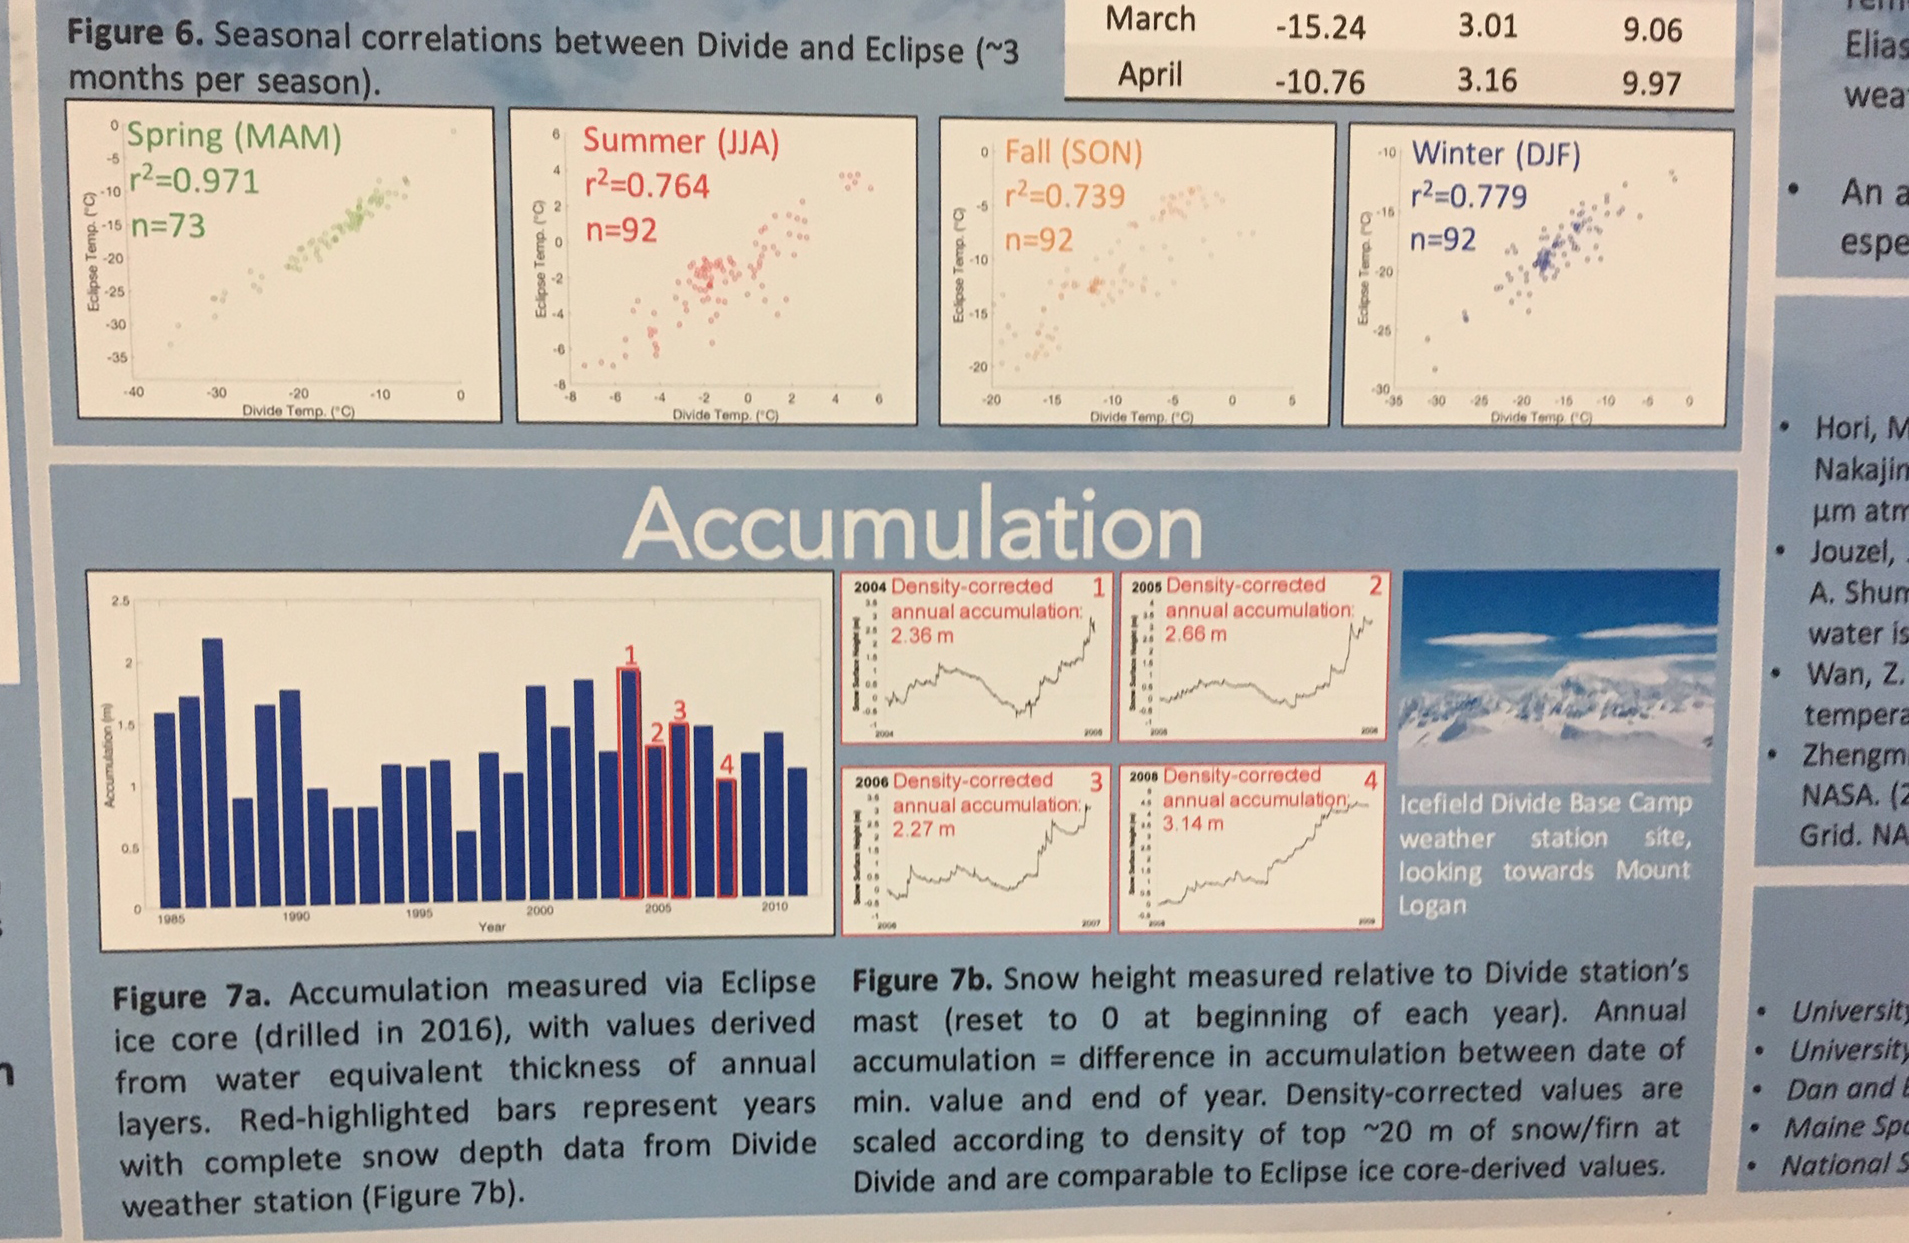
Erin McConnell, UMaine and others examined shallow ice cores from glaciers in the St. Elias Mountains of Canada’s Yukon as part of a project to reconstruct past climate variability using ice cores. The study quantified the relationships between meteorological data and ice core records in the St. Elias. The focus was on Icefield Divide, 2,900 m and Eclipse Icefield, 3,017 m. In June 2018 they extracted two ice cores (10 m and 20 m) from Divide. at Eclipse. In addition they did a 400 MHz radar transect at Divide which showed a strong reflectance at ~30 m depth, that likely indicates a firn aquifer, that develops from meltwater percolation and causes the isotope signal to deteriorate below the 2017/2018 snowpack (~6 m depth). GPR data from Eclipse Icefield shows no evidence of an aquifer, suggesting the process in the St. Elias may occur only below ~3,000 m elevation. The results pictured contrast annual accumulation at the two sites.
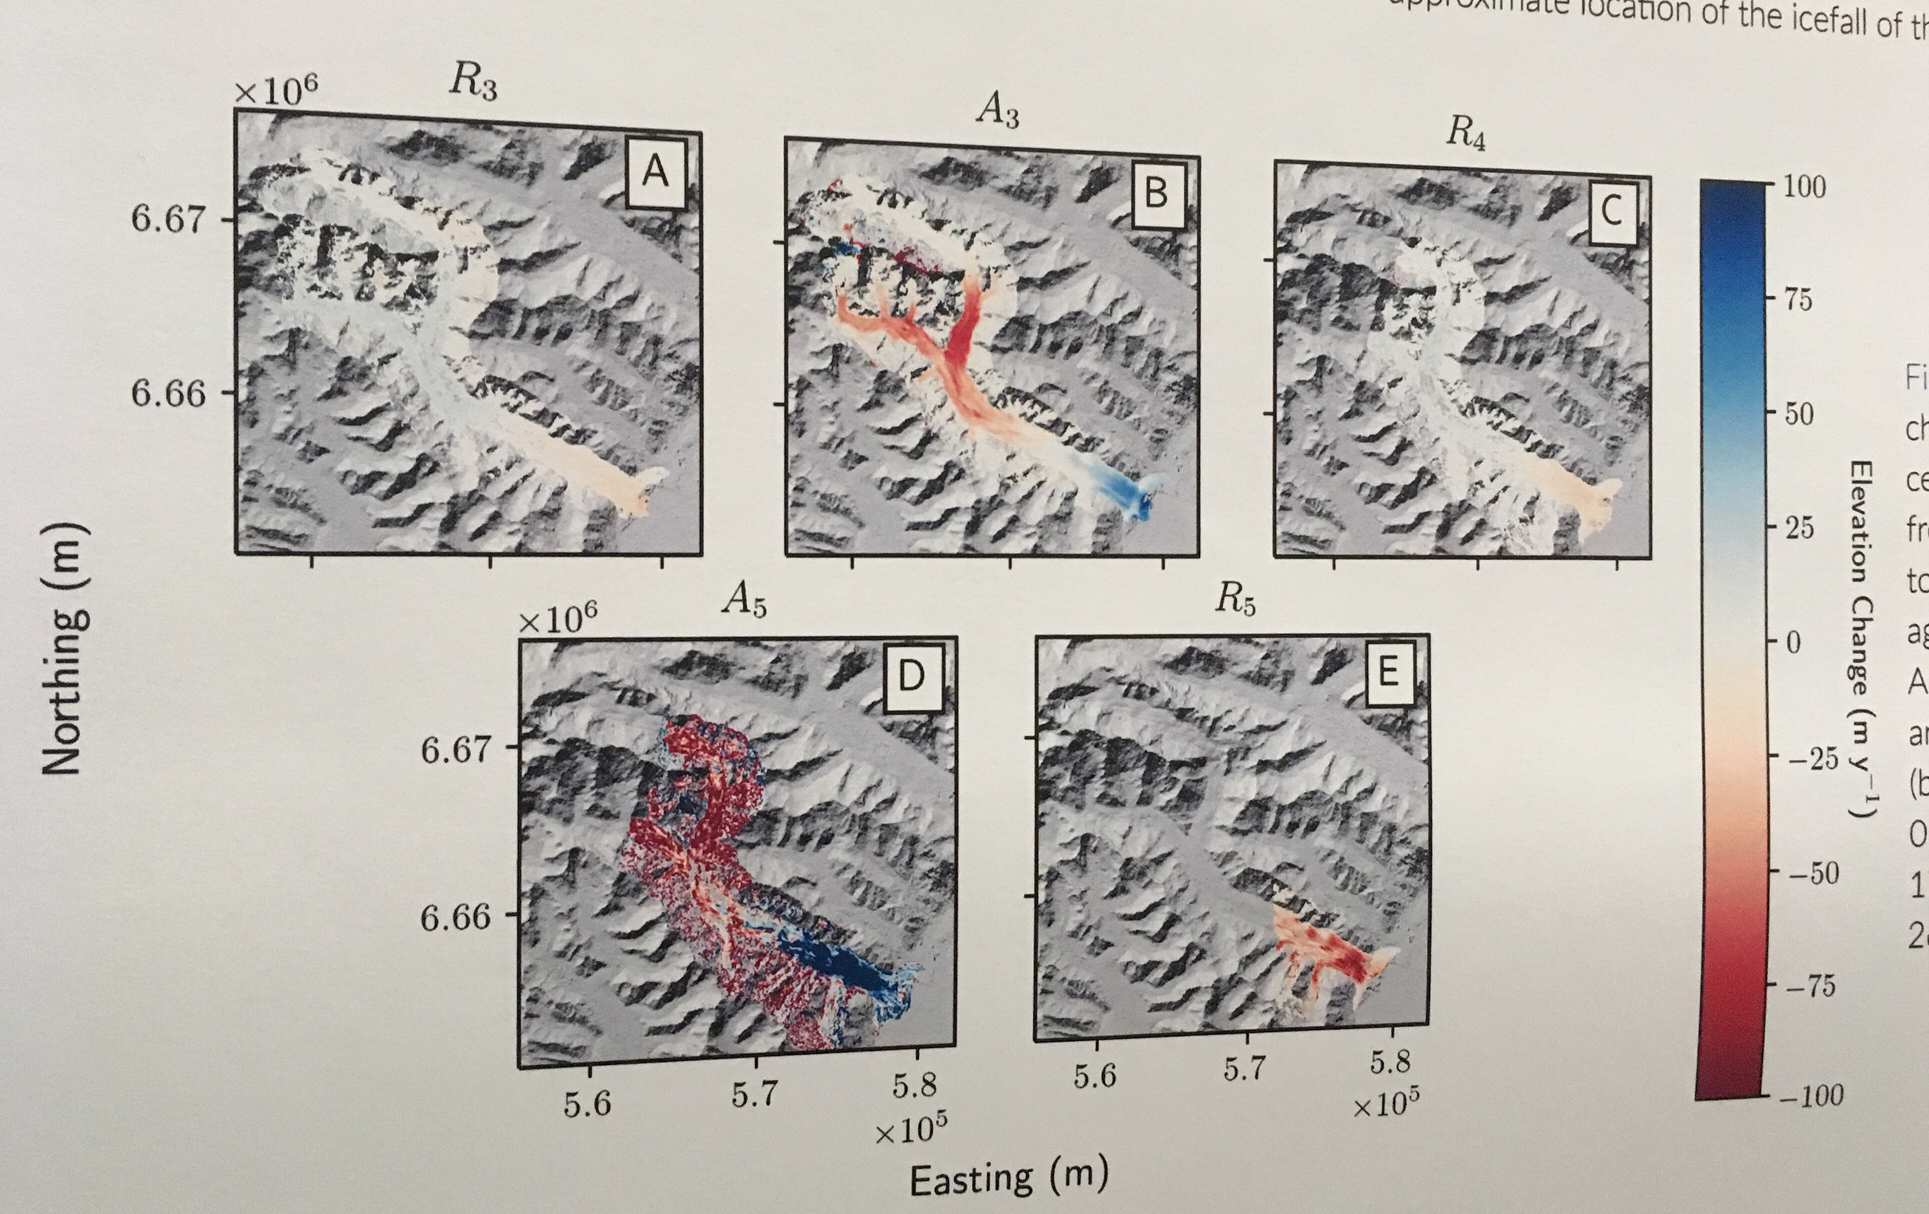
Andrew Nolan and others, from UMaine examined the surging Turner Glacier. Surge glaciers exhibit a short active phase of rapid ice velocity followed by a longer quiescent phase of slower flow. Turner Glacier is in the St. Elias Mountains, Alaska adjacent to Hubbard Glacier. Using a Landsat archive for the 1984 to 2017 period they found five previously unexamined surge events. Surge events occurred in 1985-1986, 1991-1993, 1999-2002, 2006-2008, and 2011-2013. This indicates a ~5-year surge repeat interval. They used ASTER digital elevation models from the 2006-2007 and 2011-2013 to show mass build up in the reservoir zone which initiates the surge, prior to the surge. The surge then redistributes the mass to the terminus zone. The reservoir zone surface elevation increased 50 meters preceding the 2005-2008 surge event and then subsided 100 meters and the terminus zone rose 75 meters. The image below indicates thinning in red upglacier and thickenning in blue downglacier.
Pacifica Askitrea Takata-Glushkoff of University of Alaska Fairbanks and others examined the glacier dynamics of High Mountain Asia (HMA) glaciers. She used a glacier evolution model to account for geometry changes from surface mass-balance feedback. Previously used scaling methods are simpler than flow models, but they do not account for glacier thinning. Glaciers typically show most thinning at lower elevations and least thinning at higher elevations, with various factors influencing these relative thinning patterns. She investigated glacier thinning variability with elevation, in order to account for retreat . Using geodetic data from 170 glaciers in the High Mountain Asia region, they determined for each glacier how normalized changes in ice thickness vary with elevation. They investigated whether those normalized curves are impacted by factors such as glacier area, slope, aspect, debris cover, length, and glacier terminus elevation. Results indicate that shallow slopes and less debris cover are both associated with more relative glacier thinning toward the glacier terminus.

Andrew Hengst and others from Appalachian State University mapped pro-glacial lakes in Northwestern North America to better understand . They used a semi-automated algorithm to delineate proglacial lakes and analyze proglacial lake area change over the satellite record to investigate lake growth rates and physical controls. This approach allows robust identification and analysis of proglacial lake area change utilizing the complete Landsat satellite record . The use of an object-based processing algorithm enabled automatic location and tracking proglacial lakes over large spatial and temporal scales to increase understanding of the dynamics of these complex and changing systems, such as in the examples below that show lake area change. The algorithm had the most difficulty with lakes that had high suspended sediments and debris covered termini with a complex ending in the lake.

 Dean of Academic Affairs at Nichols College and Professor of Environmental Science at Nichols College in Massachusetts since 1989. Glaciologist directing the North Cascade Glacier Climate Project since 1984. This project monitors the mass balance and behavior of more glaciers than any other in North America.