
September 28, 2018
Taku Glacier, Alaska in 2018 Highest Snowline in 70+ years
Posted by Mauri Pelto
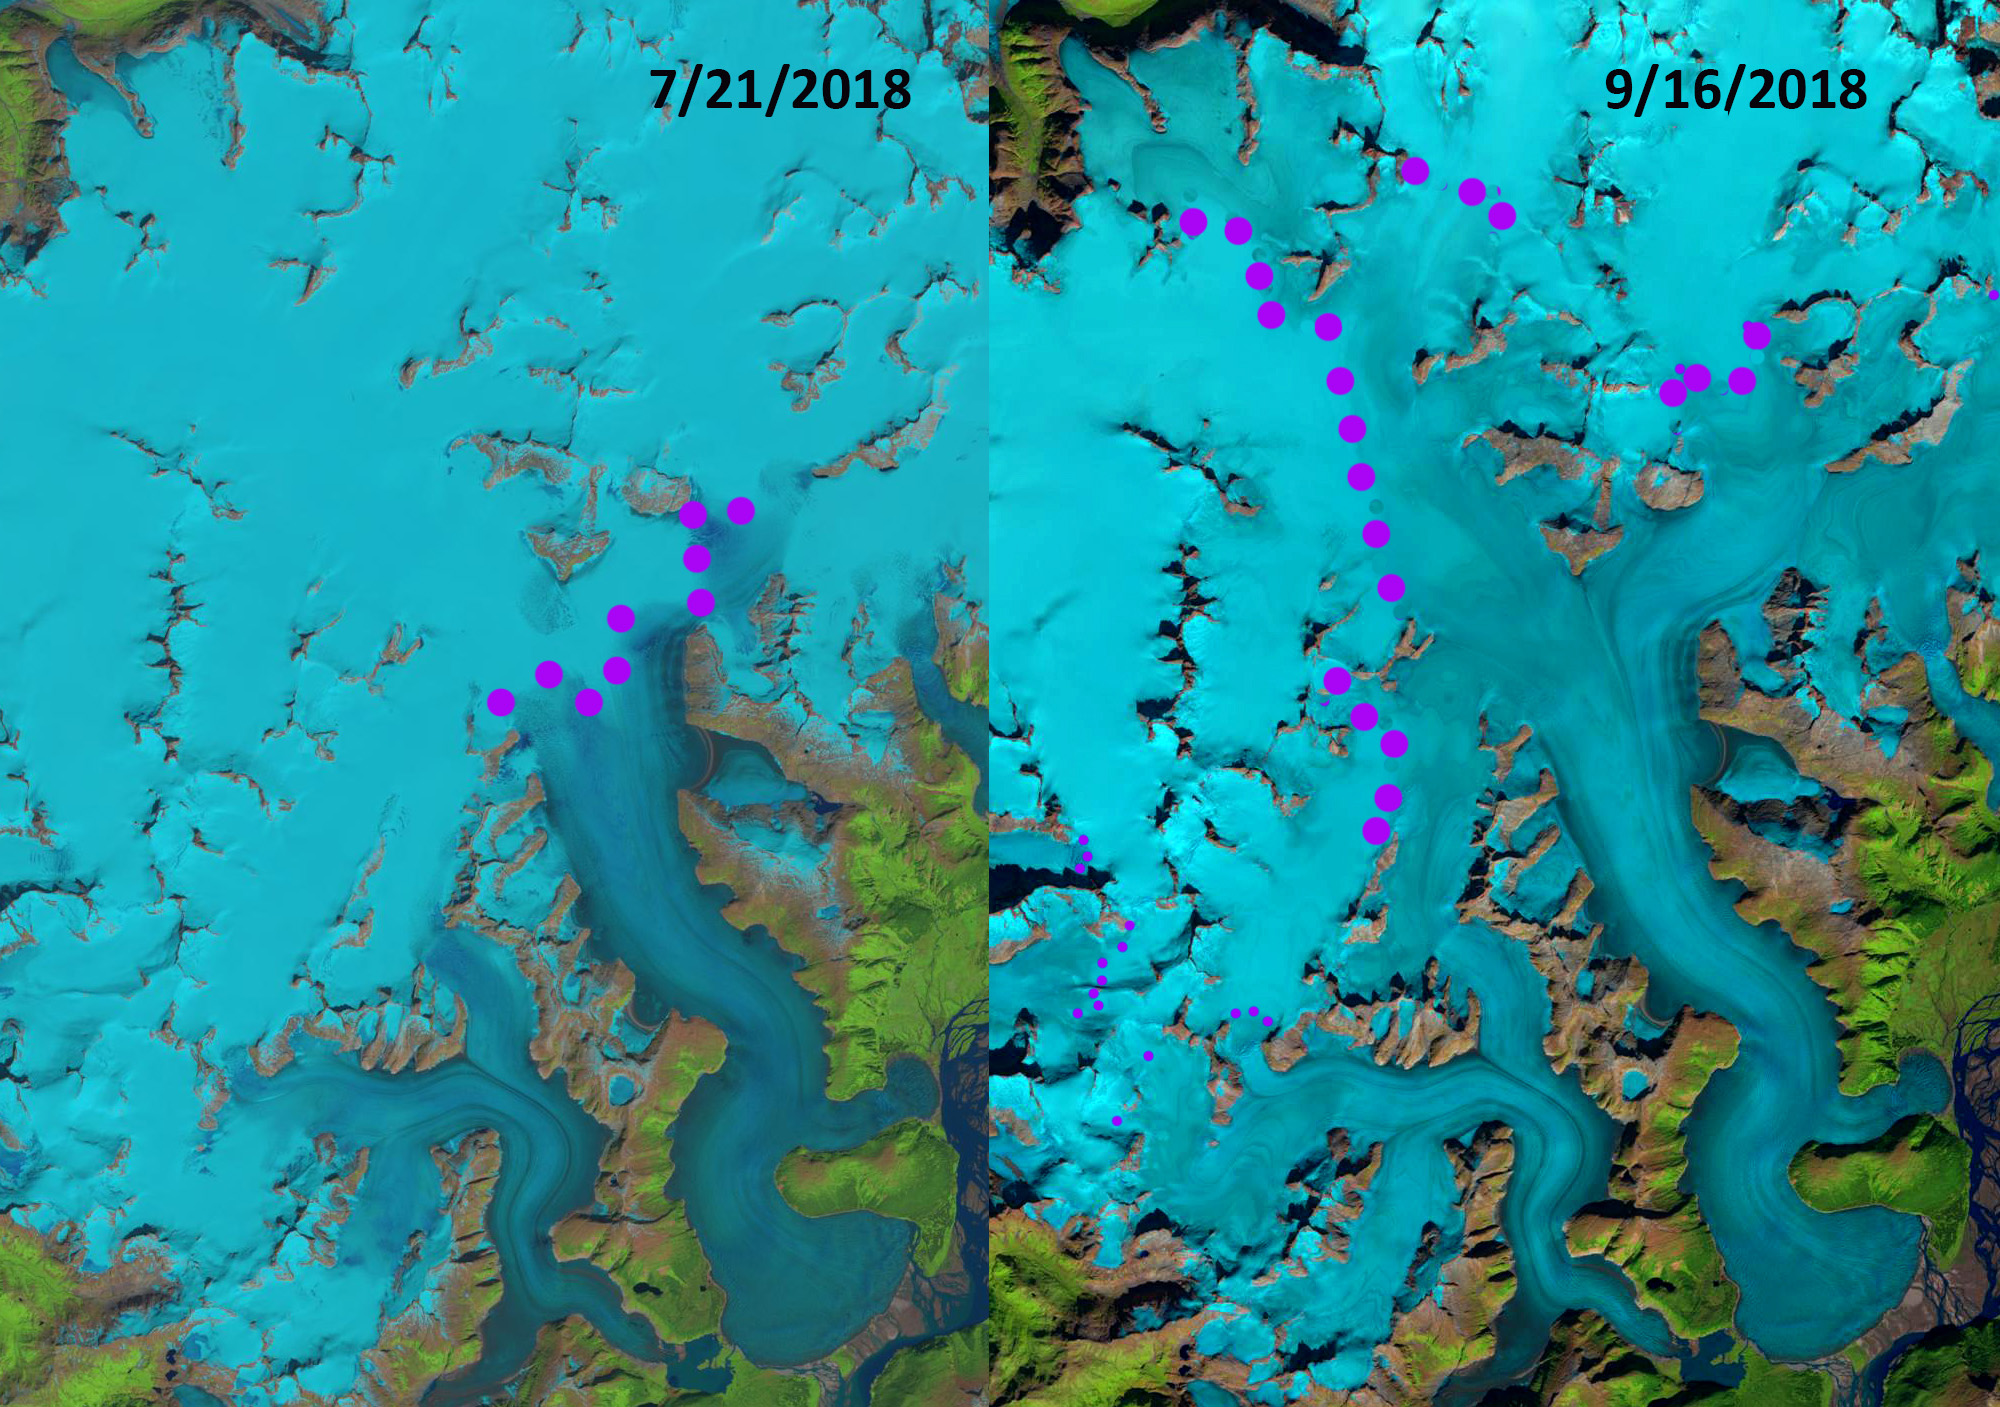
Taku Glacier transient snowline (purple dots) in Landsat images from 7/21 and 9/16/2018.
The Juneau Icefield Research Program (JIRP) has been examining the glaciers of the Juneau Icefield since 1946. Until the NASA Landsat program began, field measurements and aerial observations were the only means to observe the glaciers of the icefield. For more than 40 years it was Maynard Miller, U of Idaho, who led this expedition that has trained so many of today’s glaciologists, today it is led by Seth Campbell, U of Maine who followed Jeff Kavanaugh, U of Alberta. Landsat images have become a key resource in the examination of the mass balance of these glaciers (Pelto, 2011). The overall mass balance record of the glaciers was published this by Pelto et al (2013). On Taku Glacier, the mean annual equilibrium line altitude (ELA) has risen 85 m from the 1946–1985 period to the 1986–2018 period. Mean annual mass balance from 1946-1985 and 1986-2018, with 2018 values being preliminary, were +0.40 m/yr and −0.18 m/yr respectively, indicative of the snow line rise resulting in cessation of the long-term thickening of the glacier.
The height of the transient snowline (purple dots) at the end of the summer represents the ELA for the glacier, where ablation equals accumulation. This also is a good estimator of mass balance. The end of the summer melt season typically occurs in September. In the last three decades the average ELA has been 1000 m. In 2018 the transient snowline on July 21 was at 975 m, and by July 30 the TSL was above 1075 m. On Sept. 16, 2018 the snowline was at 1400 m on average, the highest observed since records began in 1946. This is a rise of 425 m in ~57 days. Given the balance gradient observed on the glacier of ~3.3 mm/m this represents ablation of 1.4 m w.e. snow, or 2.0 m of snow depth (Pelto et al 2013 and Roth et al 2018) The snowline on Brady Glacier, Glacier Bay was also the highest that had been observed in 2018. In the images below the TSL in 2013 is at 1000 m, in 2014 at 1100 m, 2015 at 1140 m, and in 2017 at 1150 m. Pelto (2017) identifies the response of the entire icefield to climate changes from 1984-2013. The 2014-2018 period has been the most negative balance 5 year period for the icefield, which will lead to continued thinning and volume loss.
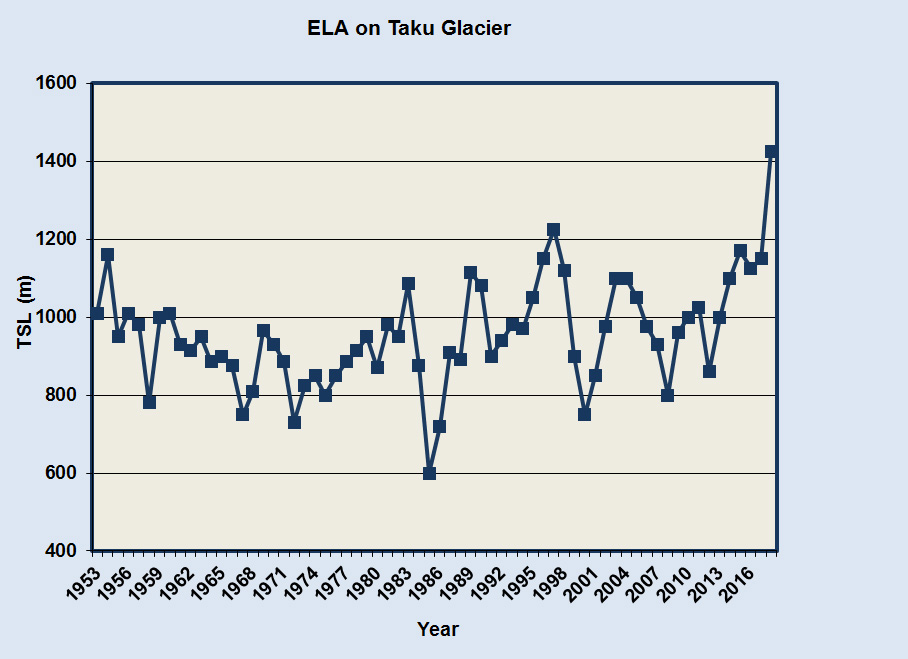
Annual equilibrium line altitude on Taku Glacier 1946-2018, 2018 is the highest and 1985 the lowest.
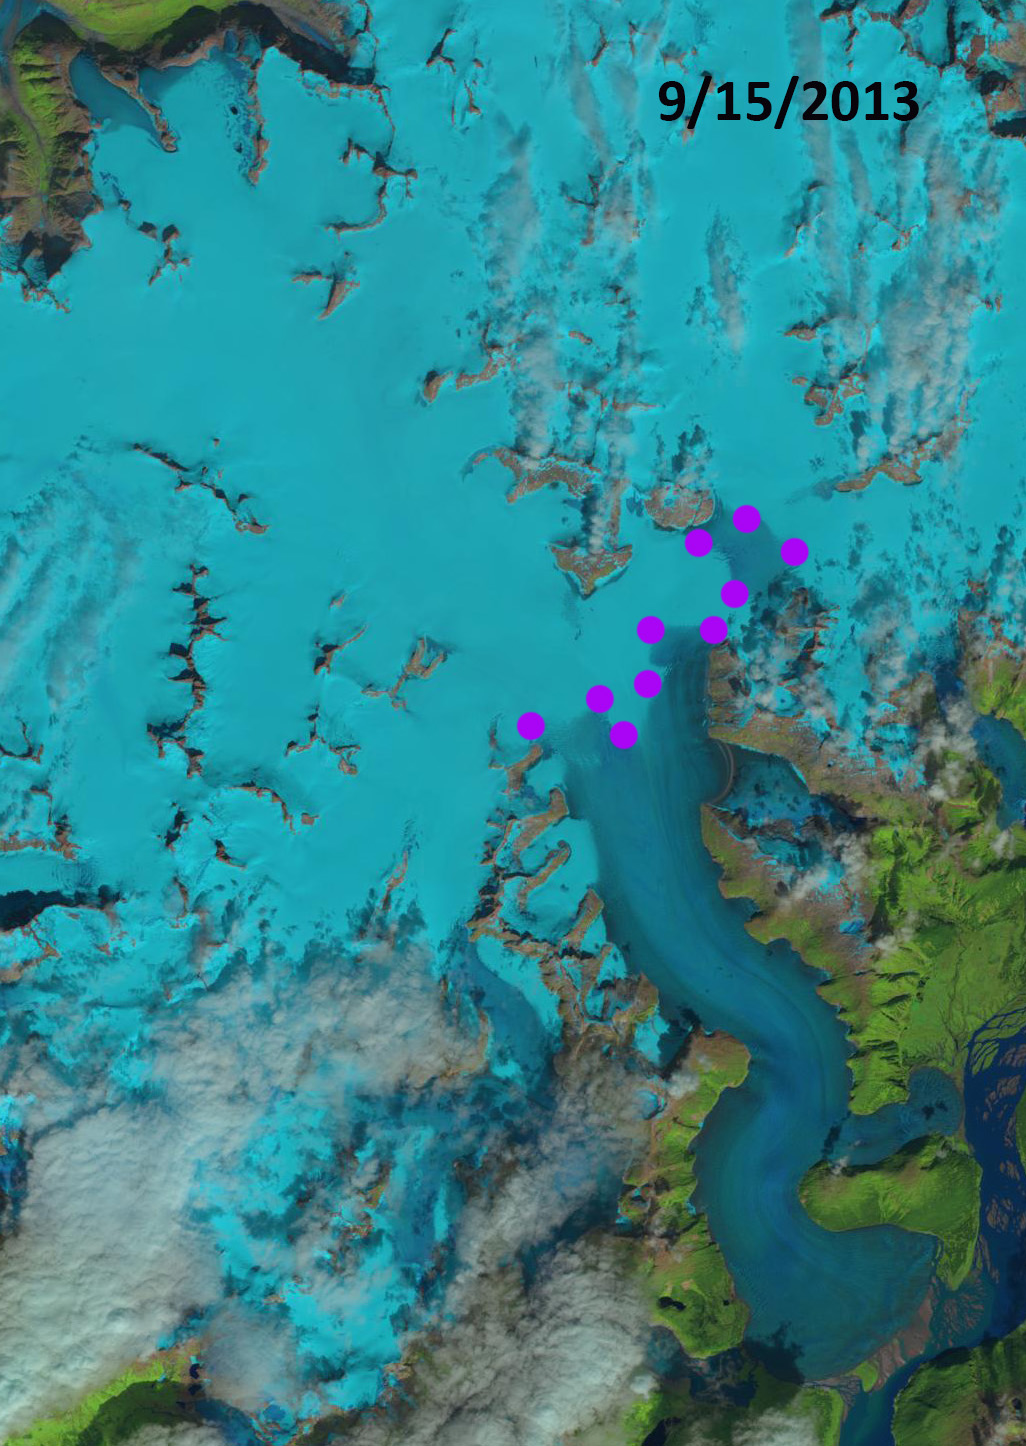
Taku Glacier transient snowline (purple dots) in Landsat image from 9/15/2013.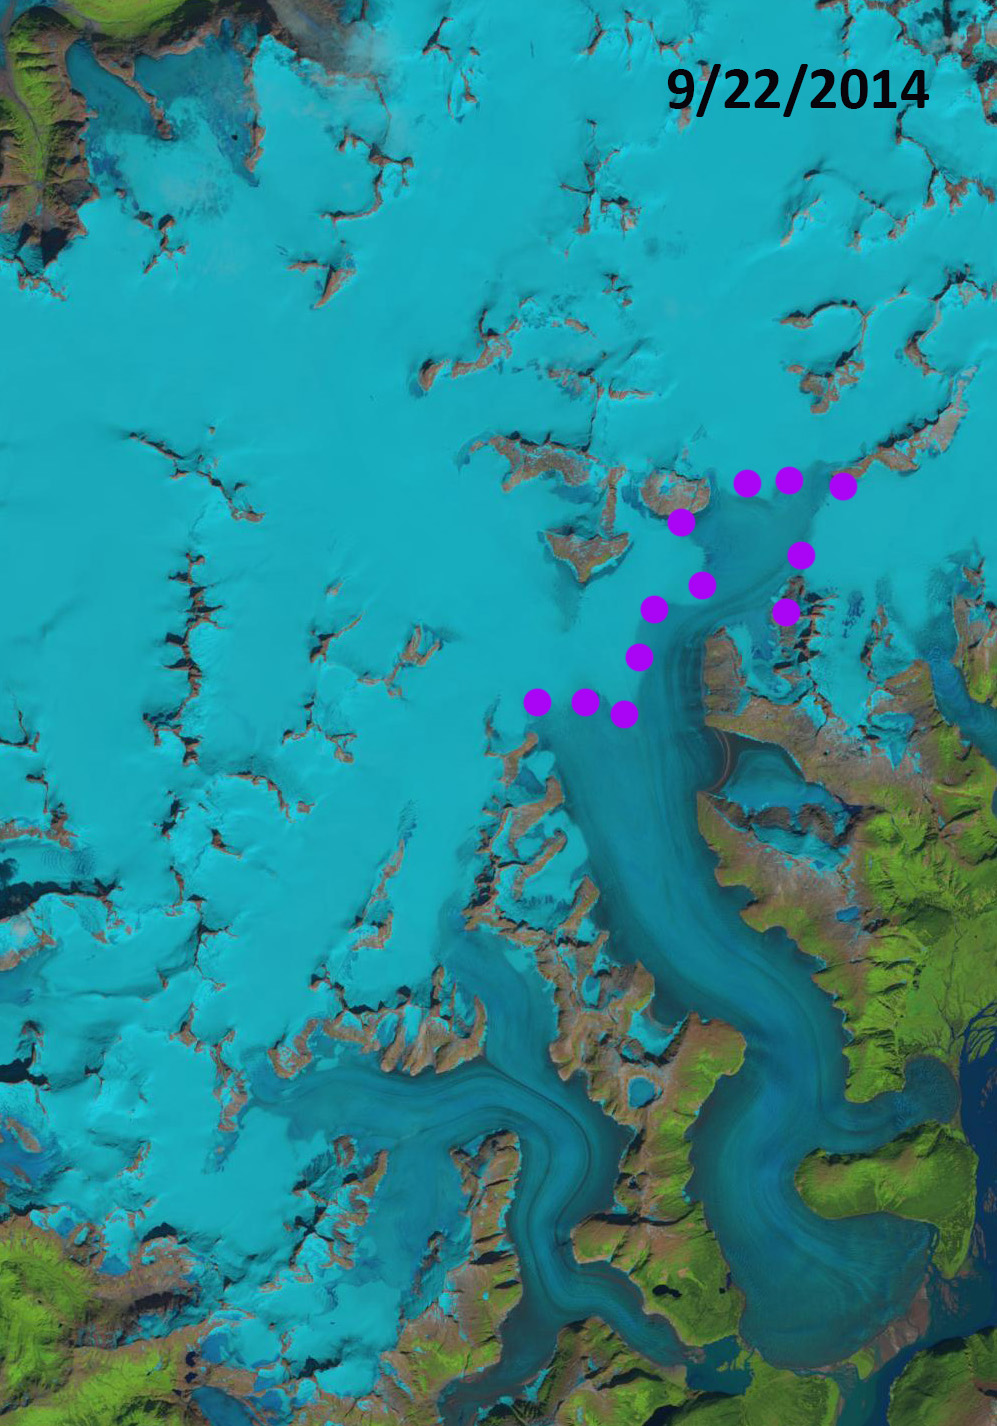
Taku Glacier transient snowline (purple dots) in Landsat images from 9/22/2014.

Taku Glacier transient snowline (purple dots) in Landsat images from 9/8/2015.
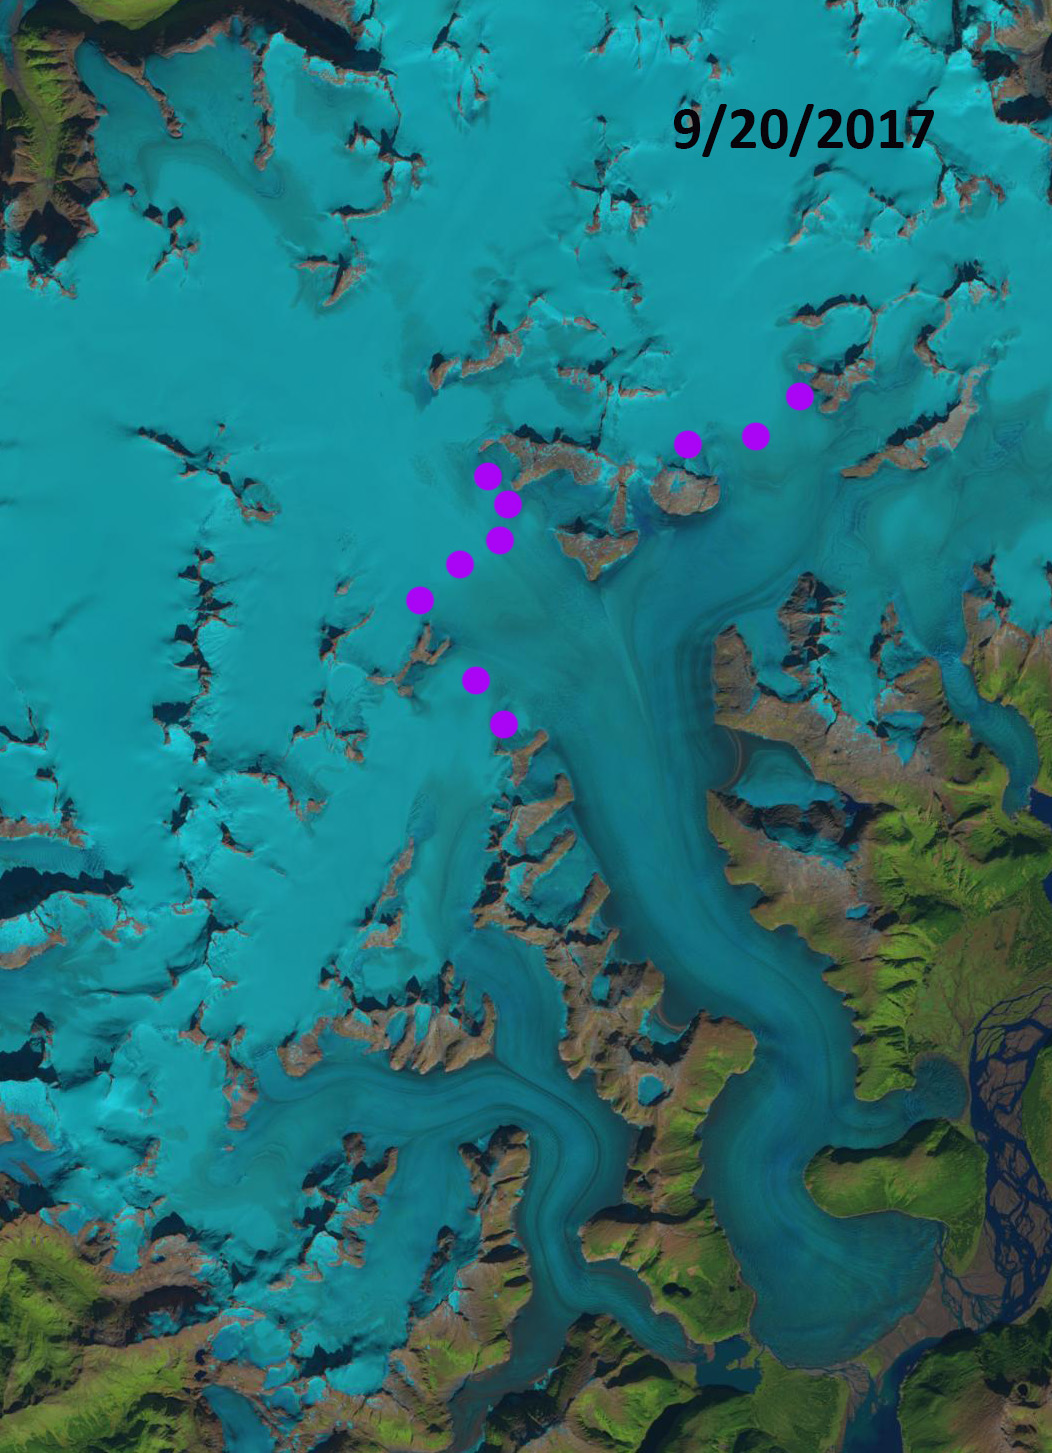
Taku Glacier transient snowline (purple dots) in Landsat images from 9/20/2017.
 Dean of Academic Affairs at Nichols College and Professor of Environmental Science at Nichols College in Massachusetts since 1989. Glaciologist directing the North Cascade Glacier Climate Project since 1984. This project monitors the mass balance and behavior of more glaciers than any other in North America.
[…] the 70+ year annual record the ELA had never exceeded 1,225 m until 2018, when it reached 1,425 m (Pelto, 2018). In 2019, the ELA again has reached a new maximum of 1,450 m (see above images). Contrast the […]