April 27, 2018
How Unusual Was 2015 in the 1984–2015 Period of the North Cascade Glacier Annual Mass Balance?
Posted by Mauri Pelto
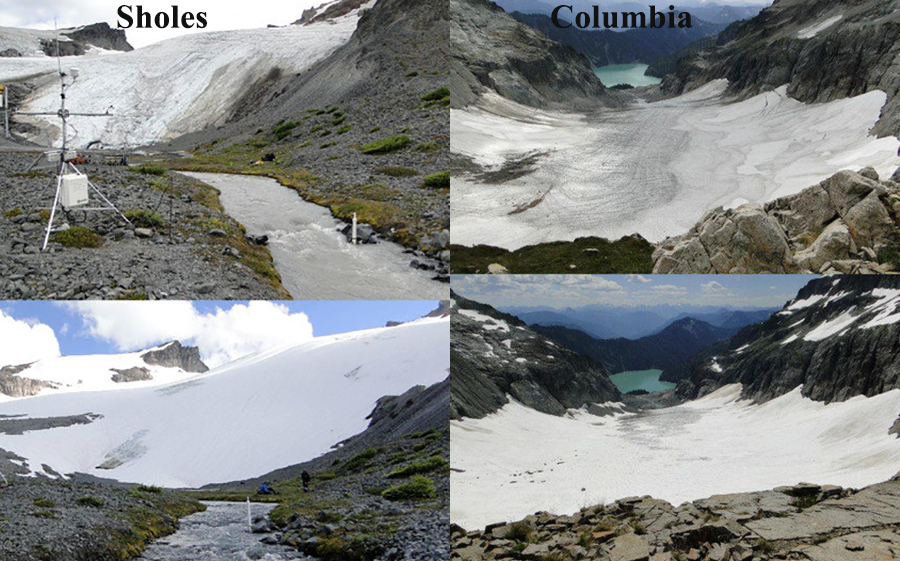
Sholes Glacier during the first week of August 2015 versus and average year such as in 2017. Note stream gage and weather station at this site. The greater extent of bare ice enhances ablation as for a given temperature there is a higher ablation rate for ice then snow. Columbia Glacier a WGMS reference glacier viewed from above the glacier at Monte Cristo Pass at the start of August in 2015 and 2016. Note the lack of retained snow in 2015 and the multiple firn layers exposed.
This post is a shortened version of the publication out this week in Water.
In 1983, the North Cascade Glacier Climate Project (NCGCP) began the annual monitoring of the mass balance on 10 glaciers throughout the Washington mountain range, in order to identify their response to climate change. Annual mass balance (Ba) measurements have continued on seven original glaciers, with an additional two glaciers being added in 1990. The measurements were discontinued on two glaciers that disappeared and one was that separated into several sections. This comparatively long record from nine glaciers in one region, using the same methods, offers some useful comparative data in order to place the impact of the regional climate warmth of 2015 in perspective. This led to the most negative annual balance of the last 26 years on every glacier.
2015 Climate
The 2015 winter accumulation season featured 51% of the mean (1984–2014) winter snow accumulation at six long-term USDA SNOTEL stations in the North Cascades, namely, Fish Creek, Lyman Lake, Park Creek, Rainy Pass, Stevens Pass, and Stampede Pass. This was exceptional as it was the second lowest out of the 32 years of the mass balance observation series. The winter season was exceptional for warmth, being the warmest winter season on record in the state of Washington. The freezing level in 2015 averaged 1645 m in the Mount Baker region from November–March, compared with an average of 1077 m (John Abatzoglou, Freezing Level Tracker). The previous record for the mean November–March freezing level, since the record began in 1948, was 1500 m.
Freezing Level November-March on Mount Baker, WA from Freezing Level Tracker 1948-2017.
Glacier Mass Balance 2015
The mean annual balance of the NCGCP glaciers is reported to the World Glacier Monitoring Service (WGMS), with two glaciers, Columbia and Rainbow Glacier, being reference glaciers. The mean Ba of the NCGCP glaciers from 1984 to 2015, was −0.54 m w.e.a−1 (water equivalent per year), ranging from −0.44 to −0.67 m w.e.a−1 for individual glaciers. In 2015, the mean Ba of nine North Cascade glaciers was −3.10 m w.e., the most negative result in the 32-year record. The correlation coefficient of Ba was above 0.80 between all North Cascade glaciers, indicating that the response was regional and not controlled by local factors. In 2015, out of the nine glaciers where the Ba was examined, the AAR was 0.00 on seven of the glaciers, 0.05 on the Rainbow Glacier, and 0.26 on the Easton Glacier. For each glacier, the 2015 Ba was the most negative of any year in their entire record. The South Cascade Glacier had a negative mass balance of −2.72 m w.e. in 2015, which was the most negative Ba reported since the suite of continuous mass balance measurements began in 1959 [USGS, 2017]. The probability of achieving the observed 2015 Ba of −3.10 is 0.34%.
On June 15, when the automatic weather station and discharge station were installed adjacent to the Sholes Glacier, the snowpack was similar to a typical early August snow cover. On the Sholes Glacier, the AAR fell from 0.55 on 9 July to 0.00 on 9 September. This was the first year since the monitoring had begun in 1984 that the mean AAR in early August was below 0.25. The result was an exposure of the older firn layers and a general decrease in albedo. In early August, the AAR was below 0.1 for all of the glaciers, except for the Easton Glacier. On the Columbia Glacier, the AAR on August 1 was the lowest observed yet at 0.12, with six weeks remaining in the melt season. The early exposure of glacier ice was important as the melt rate was faster, as was indicated by the greater melt factor. The North Cascade mass balance cumulatively over the last 30 years matches closely the global mean mass balance loss.
Map of North Cascade glaciers observed in this study.
Comparison of North Cascade cumulative and Global cumulative glacier mass balance


 Dean of Academic Affairs at Nichols College and Professor of Environmental Science at Nichols College in Massachusetts since 1989. Glaciologist directing the North Cascade Glacier Climate Project since 1984. This project monitors the mass balance and behavior of more glaciers than any other in North America.