
August 23, 2017
Observing Glacier Runoff Changes Under the Same Weather Conditions
Posted by Mauri Pelto
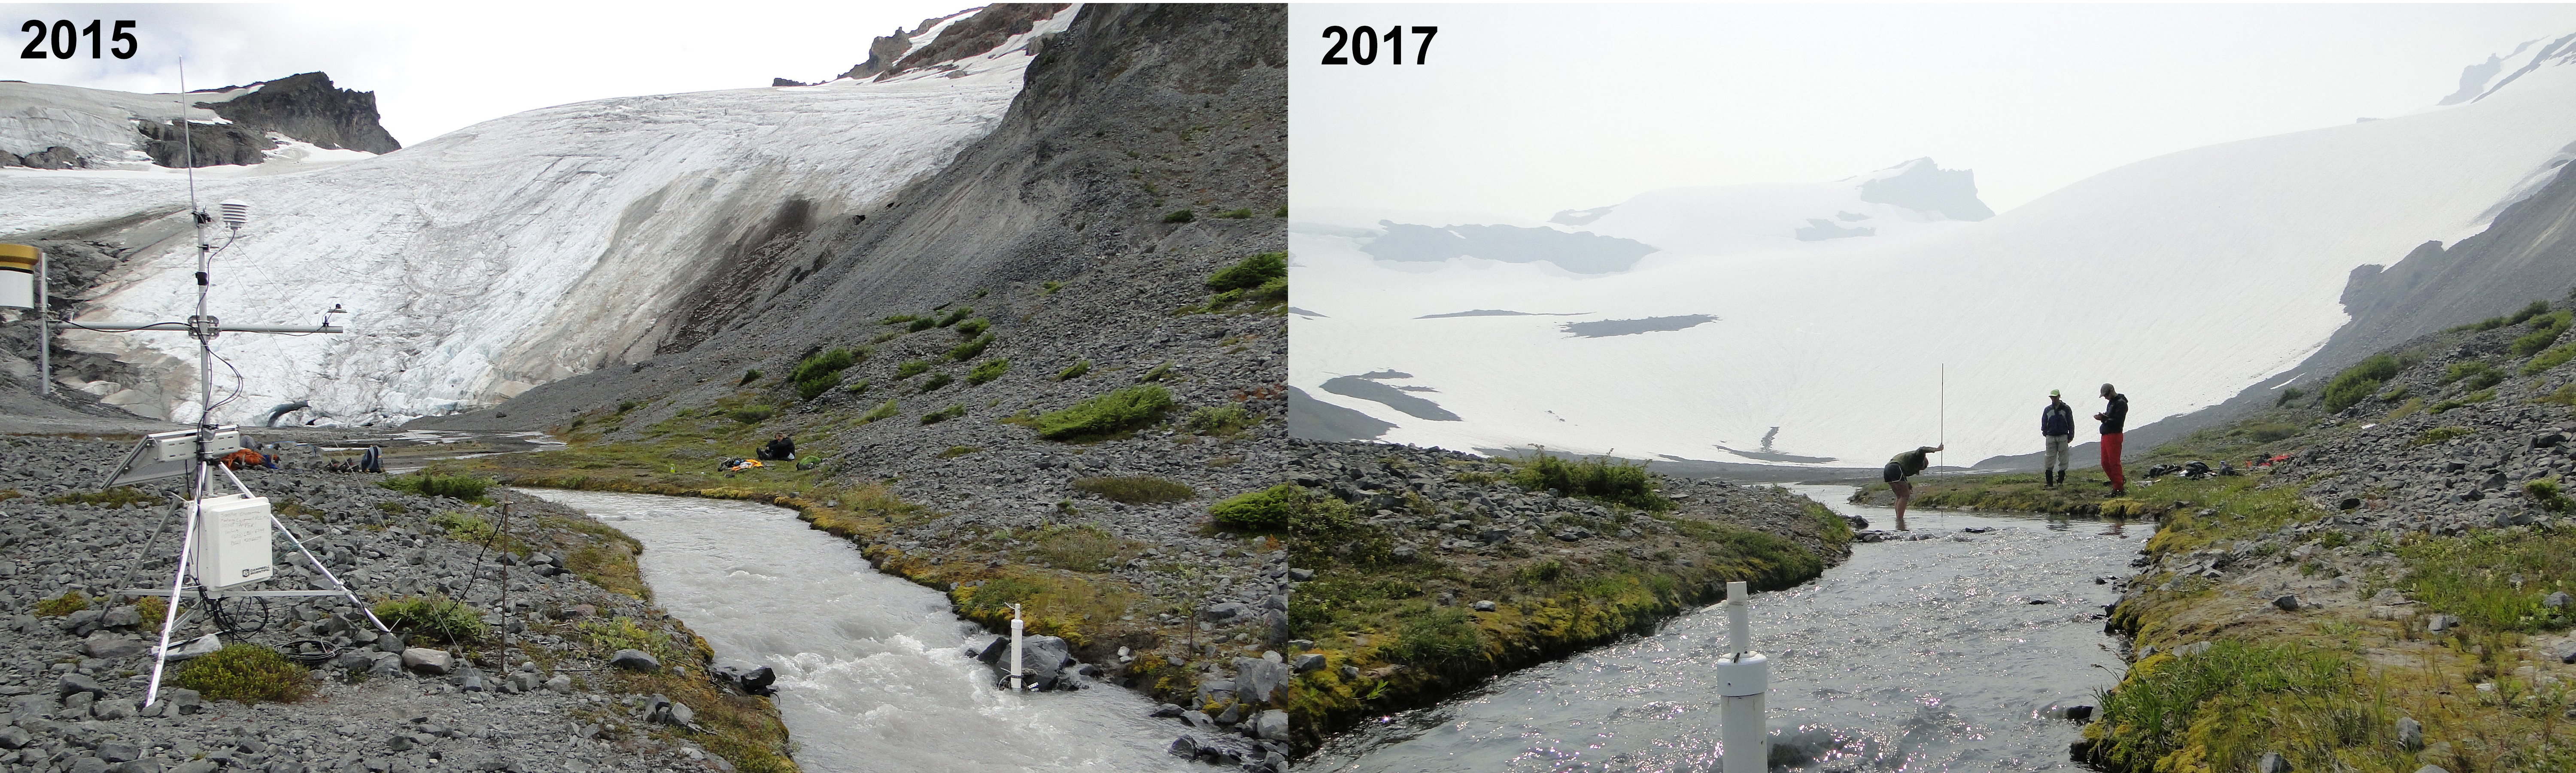
View of Sholes Glacier on August 8th in 2015 left and 2017 right. Note difference in ratio of snow surface to ice surface exposed.
Sholes Glacier is at the headwaters of Wells Creek in North Fork Nooksack River watershed in Washington. We have been measuring the mass balance of this glacier annually since 1990 and runoff in detail since 2012 (Pelto, 2015). Glacier runoff in this watershed during late summer frequently provides more than a third of all runoff for the watershed, this occurred on 37 days in 2015 and 19 days in 2016. This water is critical for local hydropower, irrigation and fall salmon runs. We measure glacier runoff all summer long directly at a stream gage 150 m from the glacier. We also measure ablation directly on the glacier. The amount of runoff is dependent on the area exposed for melting, glacier area in this case, the melt rate which is largely determined by temperature and the surface type, snow and ice having different melt rates.
A typically reliable method to calculate glacier runoff is a degree day model. This model is based solely on daily observed temperature and the glacier surface type. The degree day melt rate factor for snow and for ice are different. Based on 27 years of ablation measurements on the glacier the melt factors for snow is 0.0045 m w.e. d-1C-1 and for ice 0.0060 m w.e. d-1C-1 which falls within the range of temperate glacier observations (Hock, 2003). If you multiply this result by the area of the glacier the glacier runoff is determined.
For a specific day the determination of runoff looks like:
Glacier Runoff=( 14 C * 0.0045 m w.e. d-1C-1)(550,000 m2) + (14C*0.0060 m w.e. d-1C-1)(100,000m2)
This equals 43,000 m3 for the day or 0.5 m3/second from Sholes Glacier. In fact our measurement of discharge on this day was 41,330 m3 and the observed melt rate was within 5% of the calculated amount. In August the average streamflow in the North Fork Nooksack at the USGS gage is 22 m3/second. We have observed that ablation rates on Sholes Glacier are consistent with those on other glaciers in the watershed. For the watershed as a whole the glacier runoff on this particular day would be 9.4 m3/second or ~40% of mean daily August runoff provided by glacier melt.
It has been interesting in the case of the Sholes Glacier to observe how different the runoff rate/volume is for the same weather conditions depending solely on changes in snow and ice cover area. Note in the images above from 2015 and 2016 the change in the percent of the glacier that is snowcovered. Also note the difference below from 2014 and 2017. Given the same weather conditions the melt rate formula suggest that ice covered areas will yield 33% more runoff. This in fact has been the case with observed runoff on a 14 C day in 2015 yielding 30% more runoff than on the a 14 C day in 2017. The difference is no ice exposed in 2017 and 85% of the glacier area being bare ice on the observed day in 2015. The change during a melt season as indicated by snowcover change in 2016 from August 16th to Sept. 8th, illustrates the importance of understanding the changing distribution of snow and ice on the glacier on a weekly basis for determining glacier runoff.
On 8/8/2014 the glacier was 85% snowcovered
On 8/8/2015 the glacier was 15% snowcovered
On 8/8/2016 the glacier was 97% snowcovered
On 8/8/2017 the glacier was 100% snowcovered
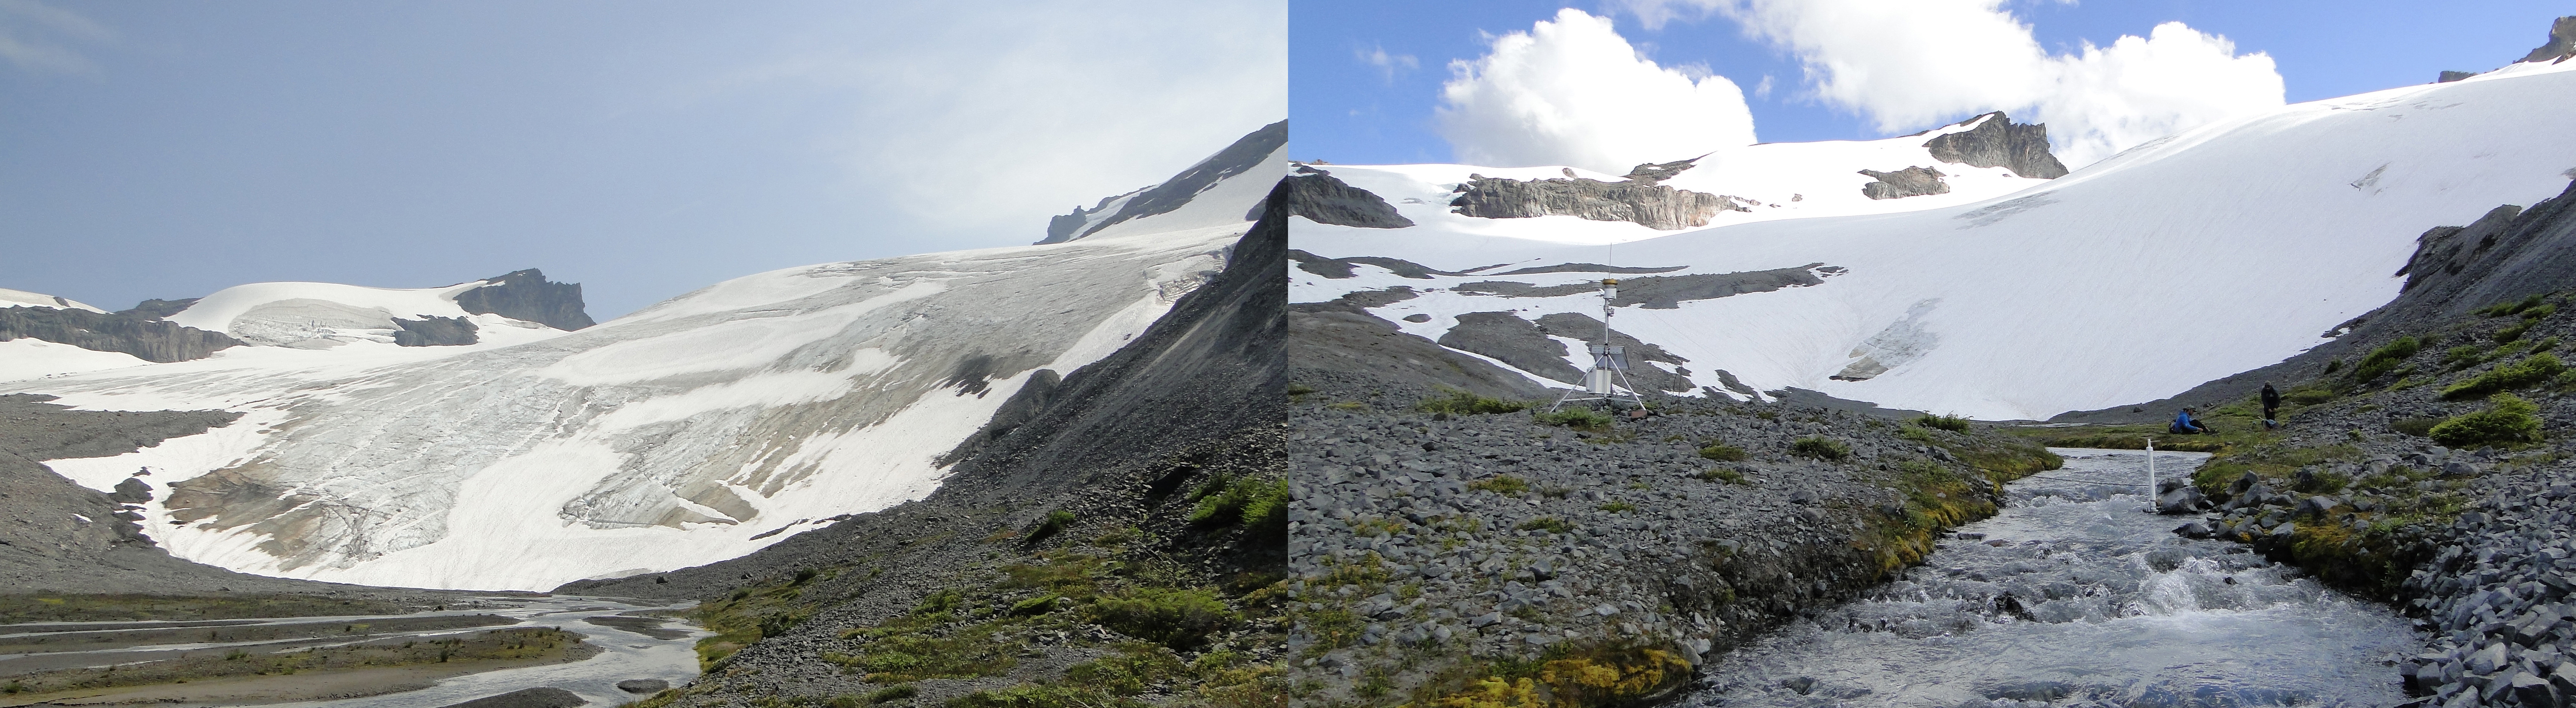
View of Sholes Glacier on August 8th in 2014 left and 2016 right. Note difference in ratio of snow surface to ice surface exposed.
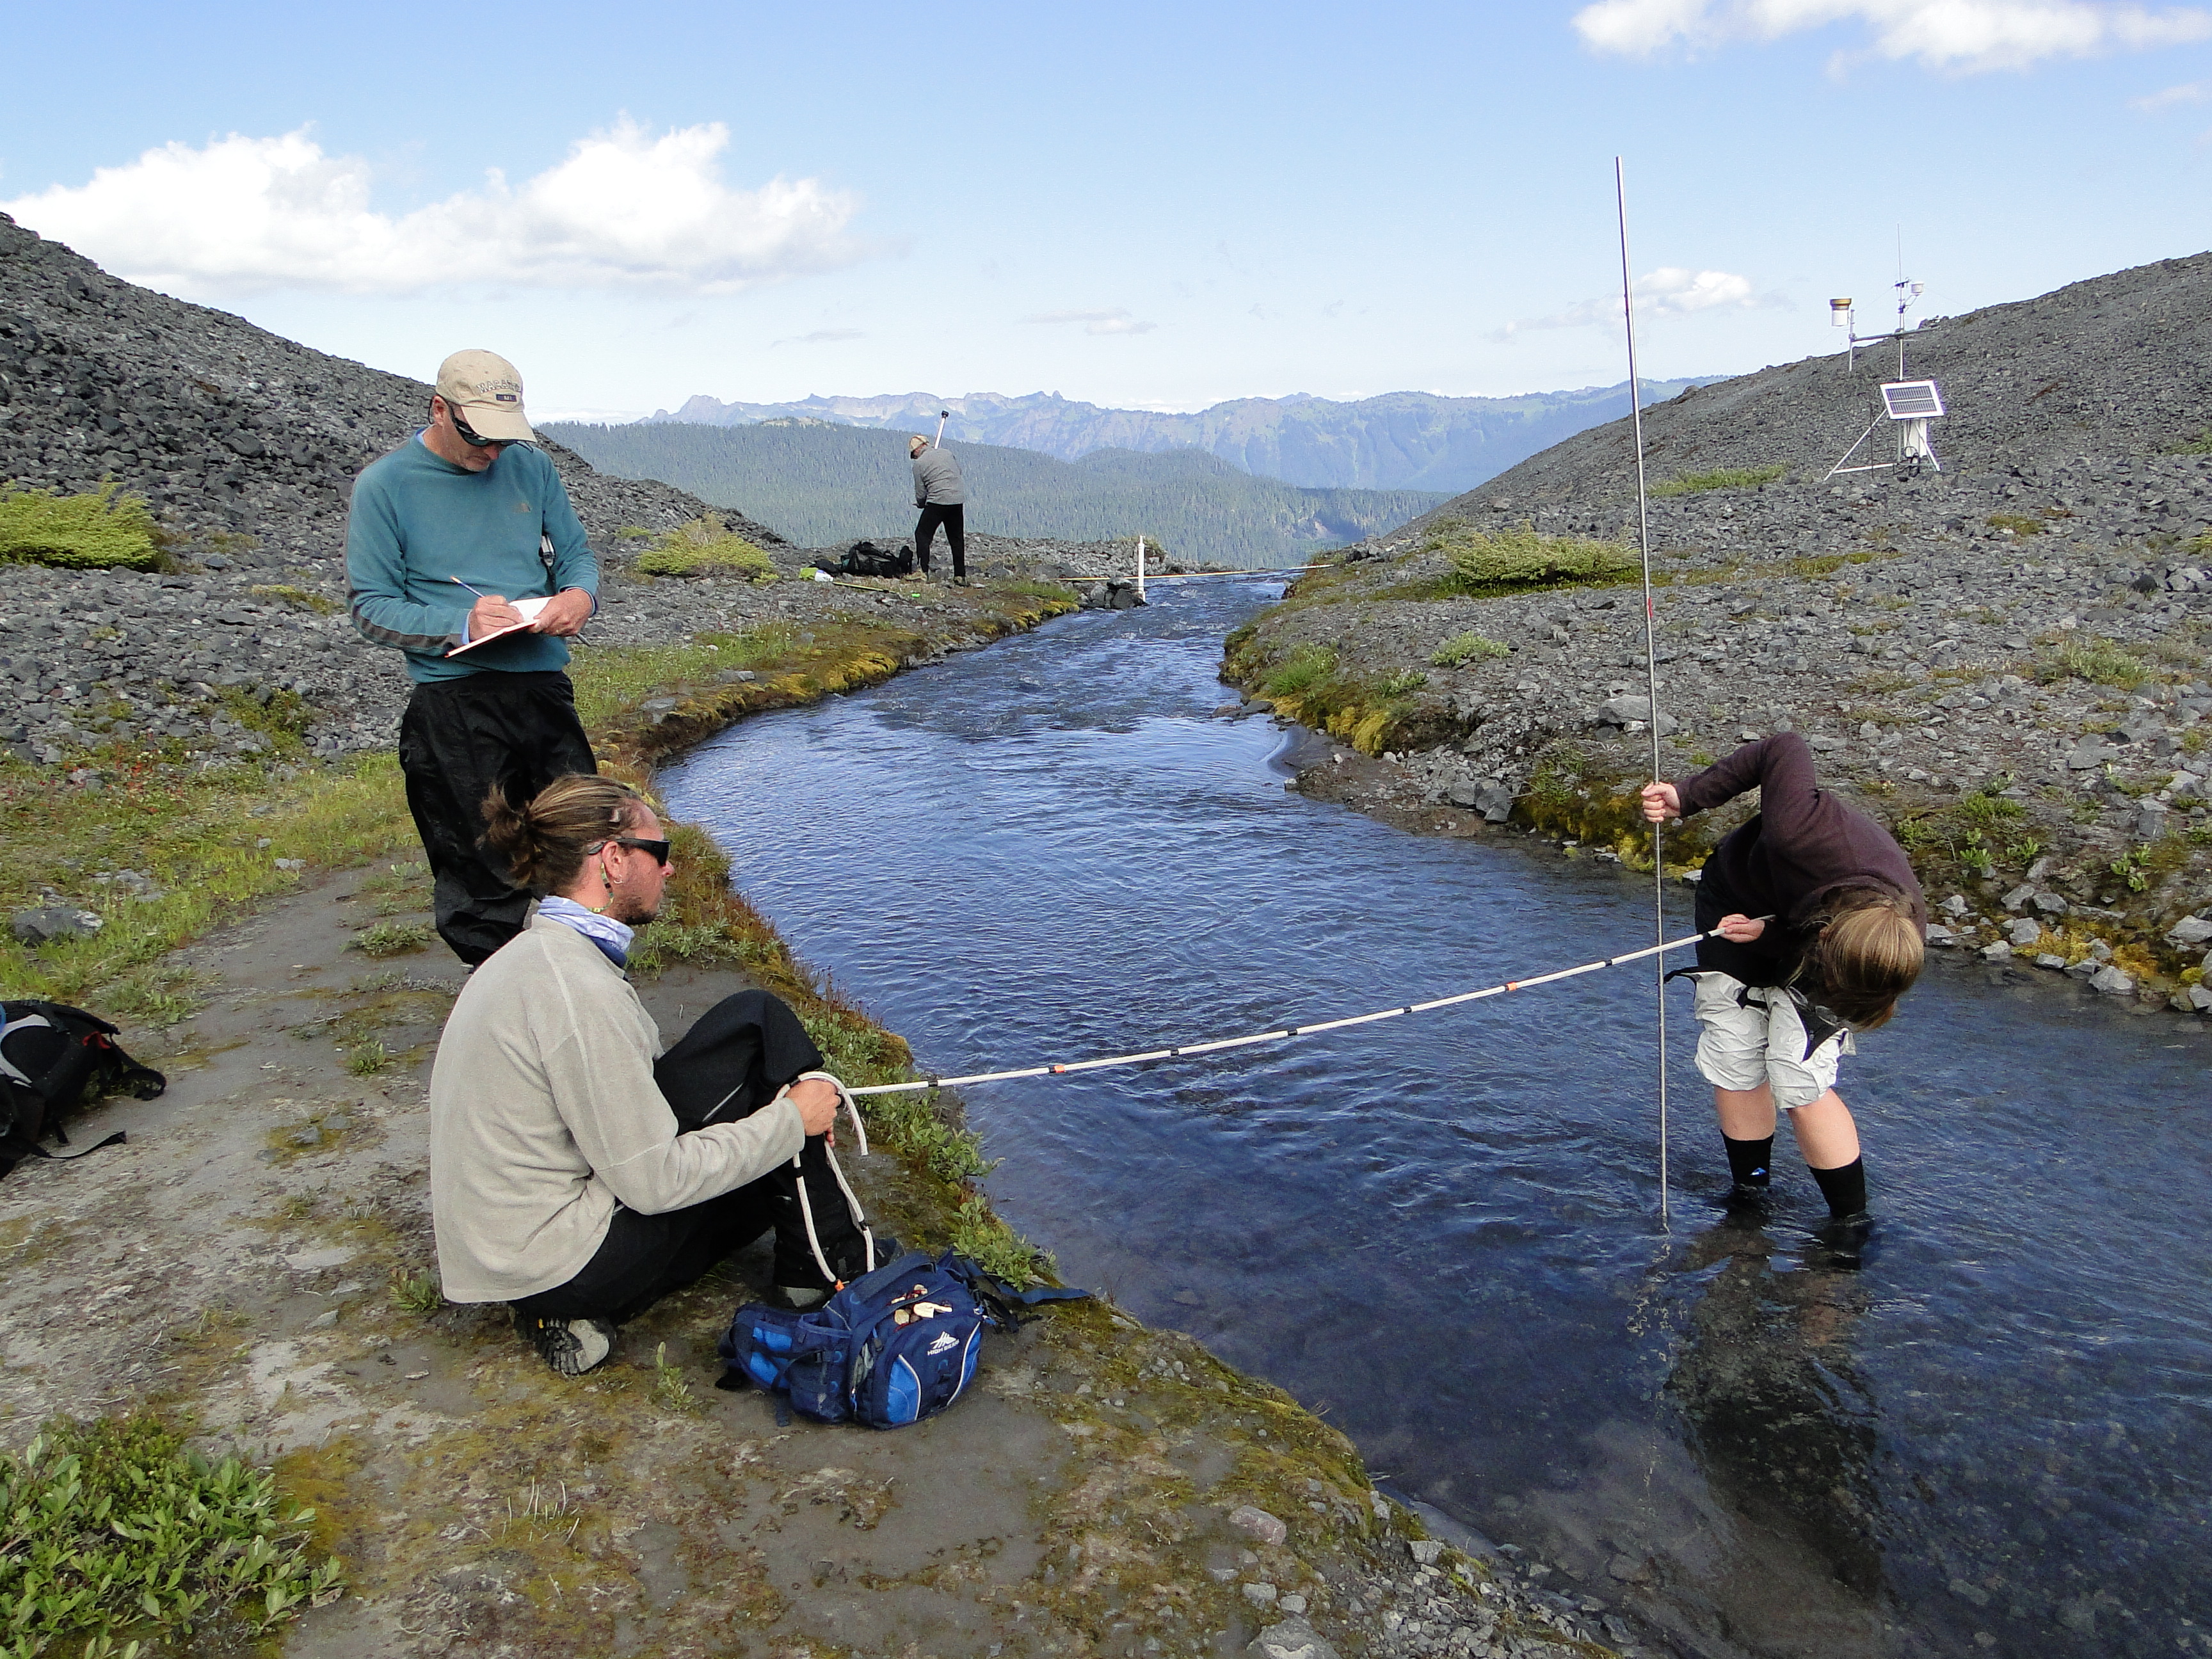
Jill Pelto and Andrew Hollyday measuring flow below Sholes Glacier.
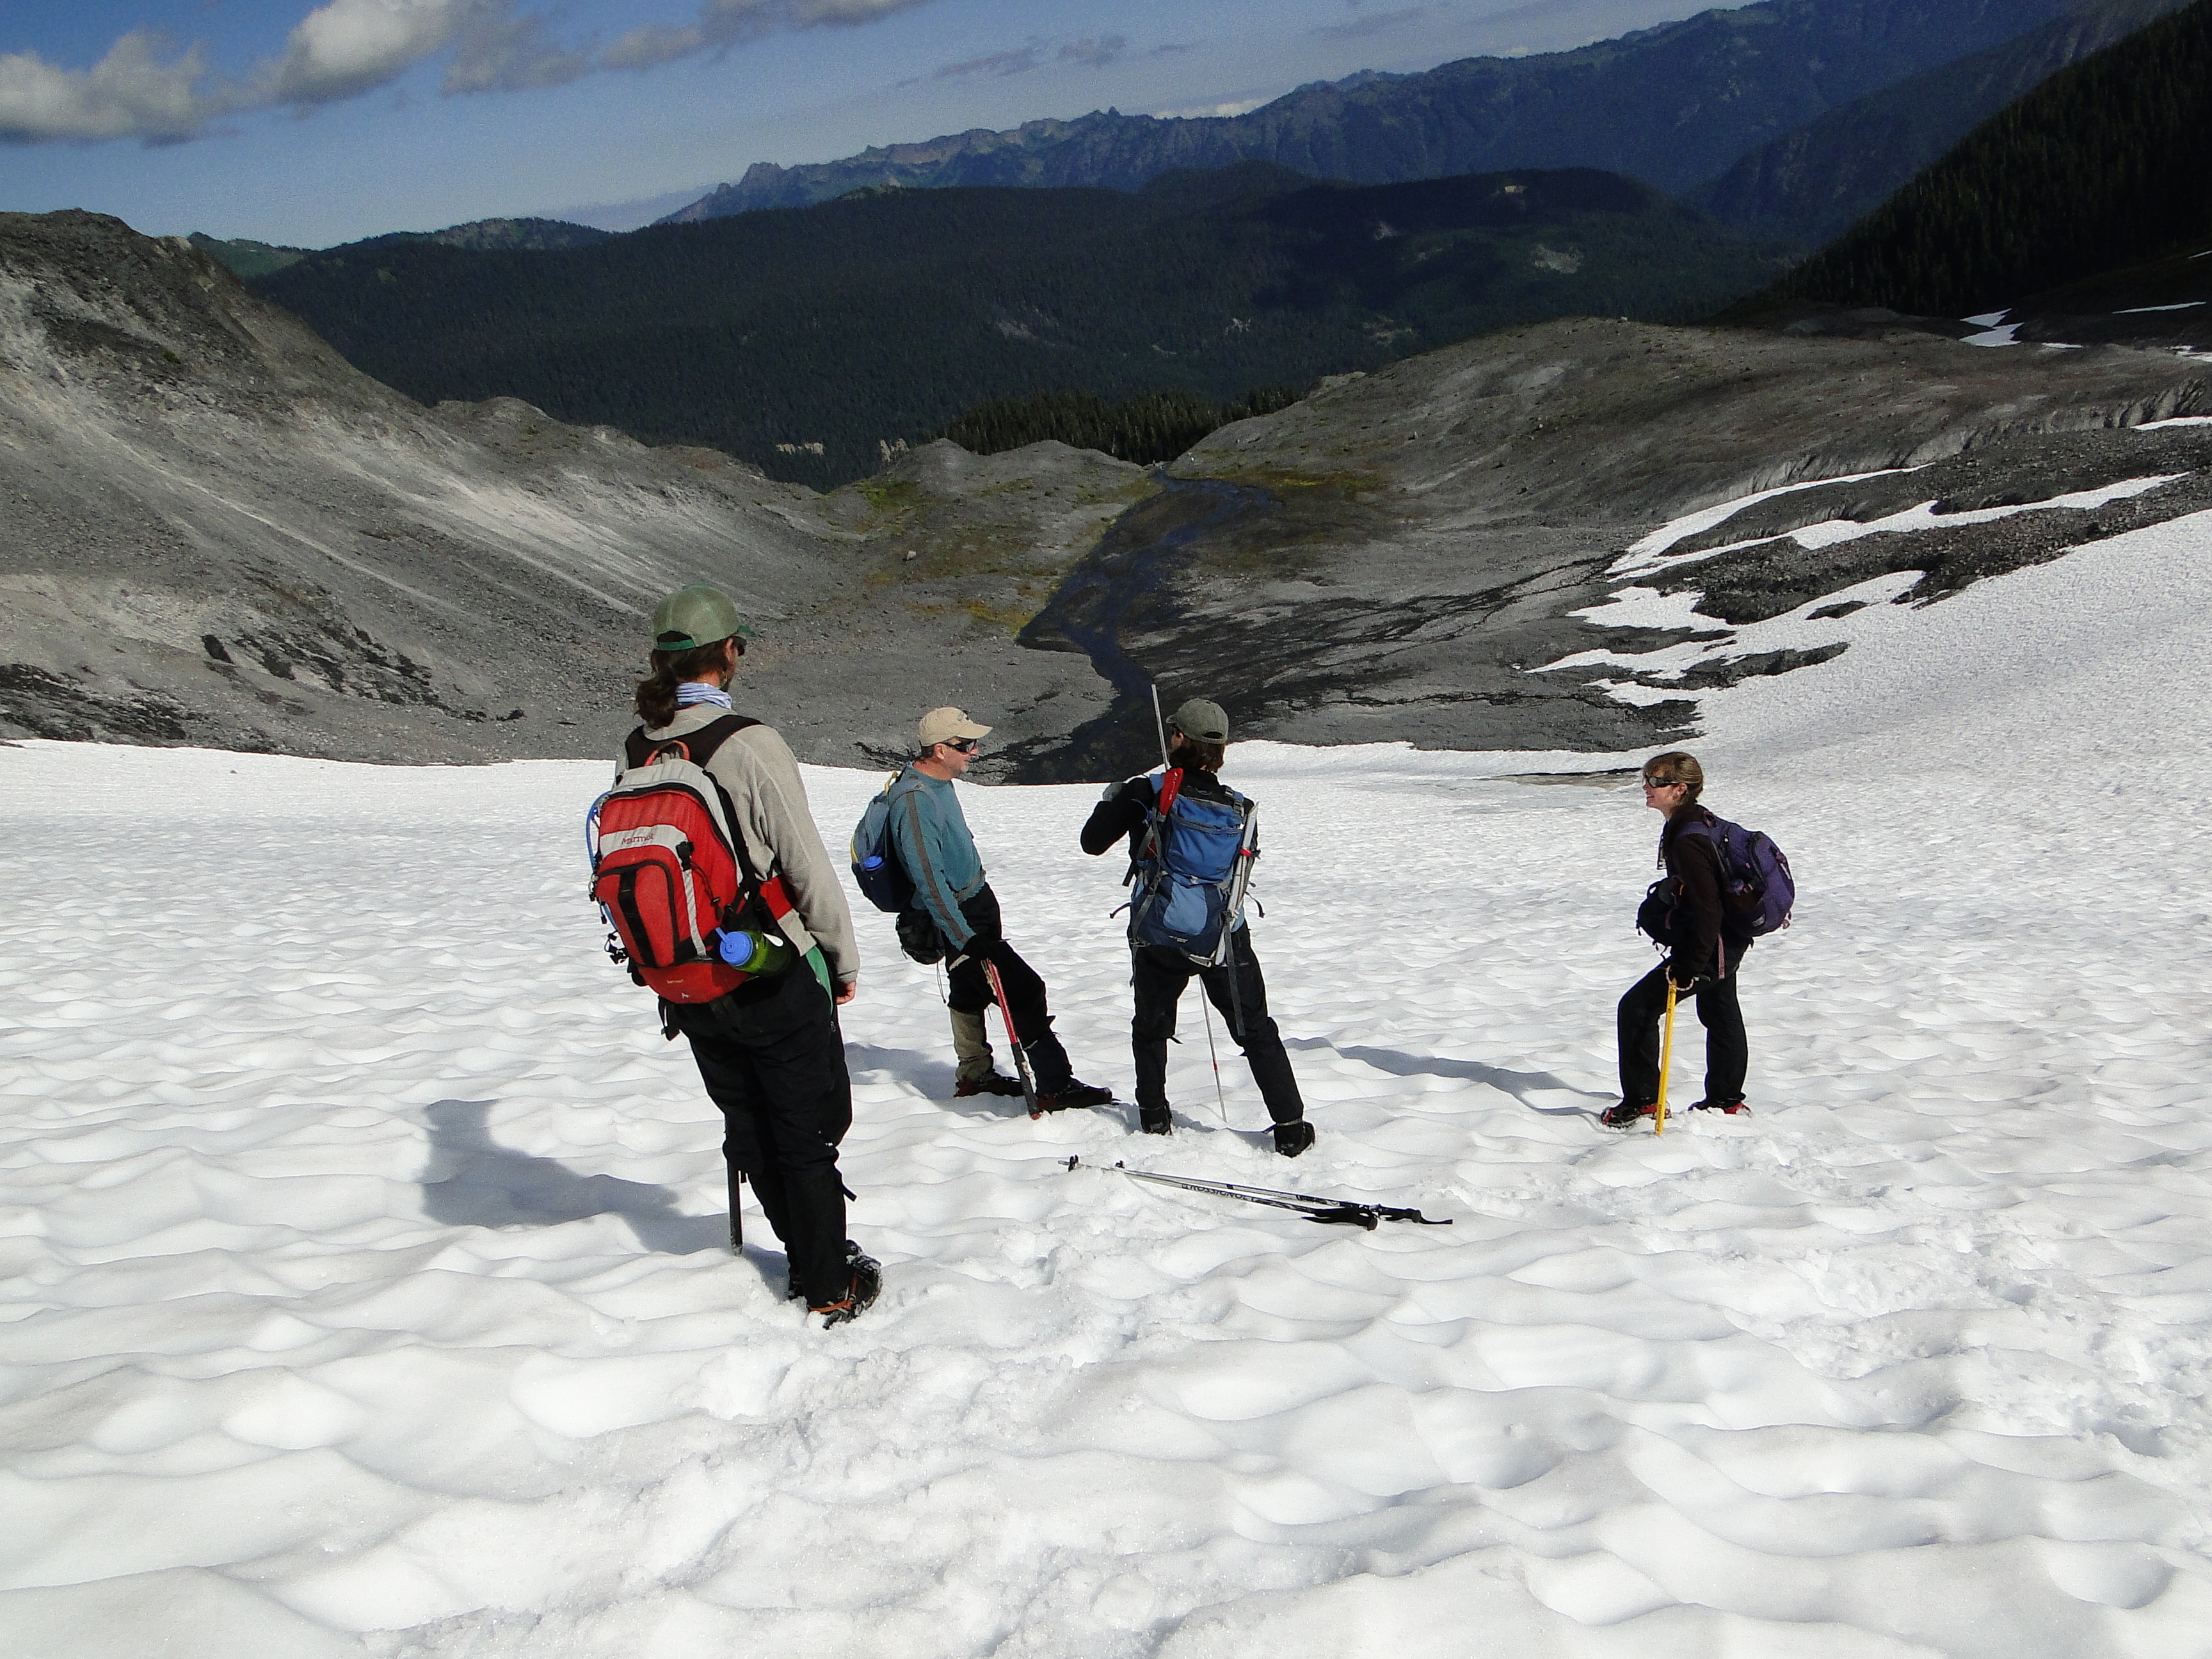
Pete Durr Probing snowpack on Sholes Glacier

Sholes Glacier August, 16 2016
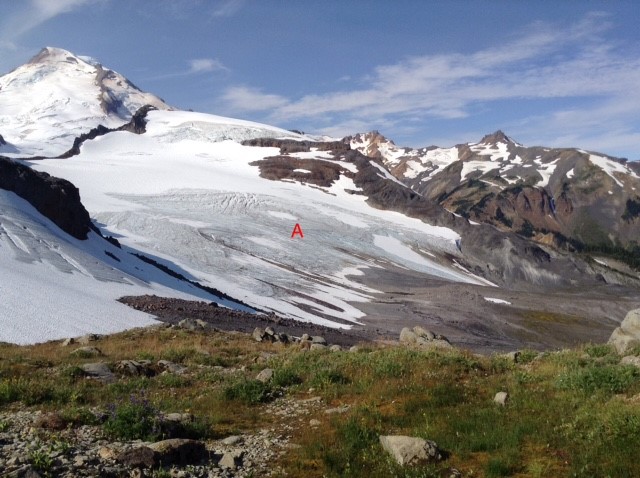
Sholes Glacier Sept., 8 2016
 Dean of Academic Affairs at Nichols College and Professor of Environmental Science at Nichols College in Massachusetts since 1989. Glaciologist directing the North Cascade Glacier Climate Project since 1984. This project monitors the mass balance and behavior of more glaciers than any other in North America.