December 26, 2016
Samudra Tapu Glacier, India Accelerated Retreat 1998-2016
Posted by Mauri Pelto
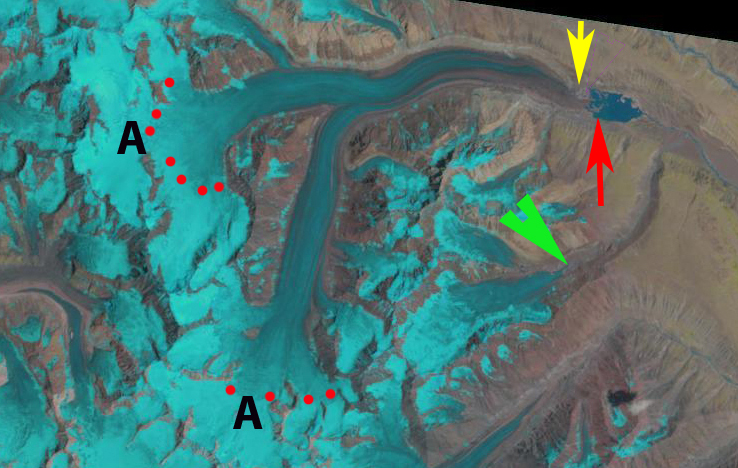
Landsat Comparison from 1998 and 2016 of Samudra Tapu Glacier, India. Red arrow is the 1998 terminus, yellow arrow the 2016 terminus, green arrow a subsidiary glacier tongue, red line and dots the snowline and pink arrow an area indicating a water level decline in the lake.
Samudra Tapu Glacier is one of the largest in the Chenab Basin, India. Maanya et al (2016) indicate the glacier terminates at 4150 m and is 16 km long and has an area of 62.5 square kilometers. In a glacier inventory in the basin by Kulkarni et al (2007) the 466 glaciers in the basin were observed to have lost 21% of their total area from 1962 to 2001. This study coordinated by the Space Applications Centre of the Indian Space Research Organization, has combined field observations of the glacier with remote sensing to observe the changes in area and length of the glaciers. The Chenab River also provides 690 MW of hydropower at the Salal Hydroelectric Project
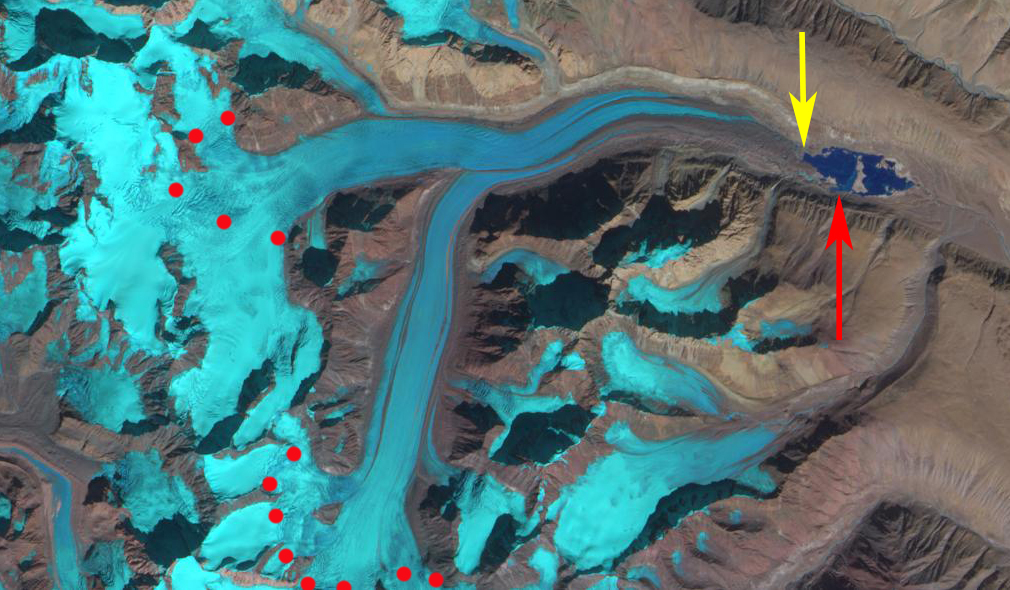
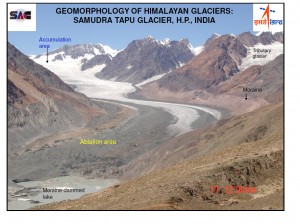
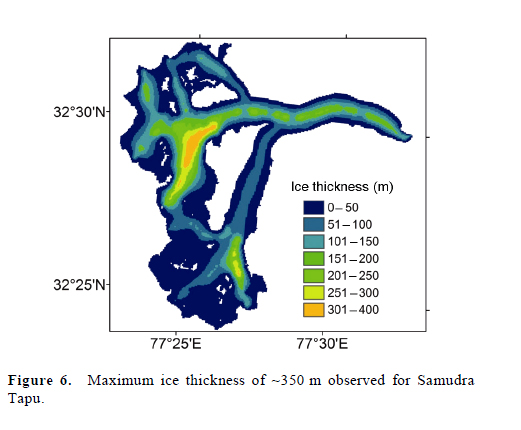
In this post we use 1998, 2002 and 2016 Landsat imagery to examine the terminus of this glacier. The terminus in 1998 is in an expanding proglacial lake and the snowline is at 5200 m. In 2002 the glacier has retreated a short distance since 1998 and the snowline is at 5300 m. Note that the smaller glacier tongue at the green arrow is disappearing. An October 2016 image indicates a further lake expansion and a glacier retreat of 600 m since 1998. The lake level has also fallen as evident by the expansion of peninsula areas in the lake, pink arrow. A Sentinel 2 image from November 11, 2016 indicates the snowline is higher than in October or during the other years observed at 5400 m. The lower glacier is heavily debris covered, has a low slope and is essentially stagnant in its lowest 1 km, note image below from Anil Kulkarni. These factors will lead to continued retreat. There are some remarkably long supraglacial streams, the longest is 3.5 km long, that further illustrate the slow velocity of the lower glacier. This is in a region where ice thickness is 100-200 m, see image below Maanya et al (2016). Neither glacier is at the end of the melt season. The glacier at the green arrow has retreated well upvalley from the green arrow. This glacier is not calving into a lake and is retreating faster than Samudra Tapu. This suggests that the debris cover is reducing melting more than the lake is enhancing melting. In November 2016 the snowline is at 5400 m. An ELA of 5300+ meters leaves an accumulation area insufficient to maintain the current glacier size. In 1970 the ELA was at 4900 meters Kulkarni et al (2007) . The retreat of Samudra Tapu is noted by Kulkarni (2006) as 20 meters/year during the 1962-2000 period. From 1998 to 2016 the glacier retreated nearly 600 m, closer to 30 meters/year. The retreat of this glacier is less than that of other large glaciers nearby Sara Umaga and Gangotri, but similar to Durung Drung Glacier.
Sentinel 2 image from 11/11/16. Red arrow is the 1998 terminus, yellow arrow the 2016 terminus, red dots the snowline.
Landsat image from 2002. Red arrow is the 1998 terminus, yellow arrow the 2016 terminus, green arrow a subsidiary glacier tongue, red dots the snowline.
Image of the debris covered stagnant terminus of Samudra Tapu from Anil Kulkarni taken in 2006
The above figure is from Maanya et al (2016).


 Dean of Academic Affairs at Nichols College and Professor of Environmental Science at Nichols College in Massachusetts since 1989. Glaciologist directing the North Cascade Glacier Climate Project since 1984. This project monitors the mass balance and behavior of more glaciers than any other in North America.