
March 30, 2016
Stange Ice Shelf, Antarctica, Maintains Stability 1989-2016
Posted by Mauri Pelto
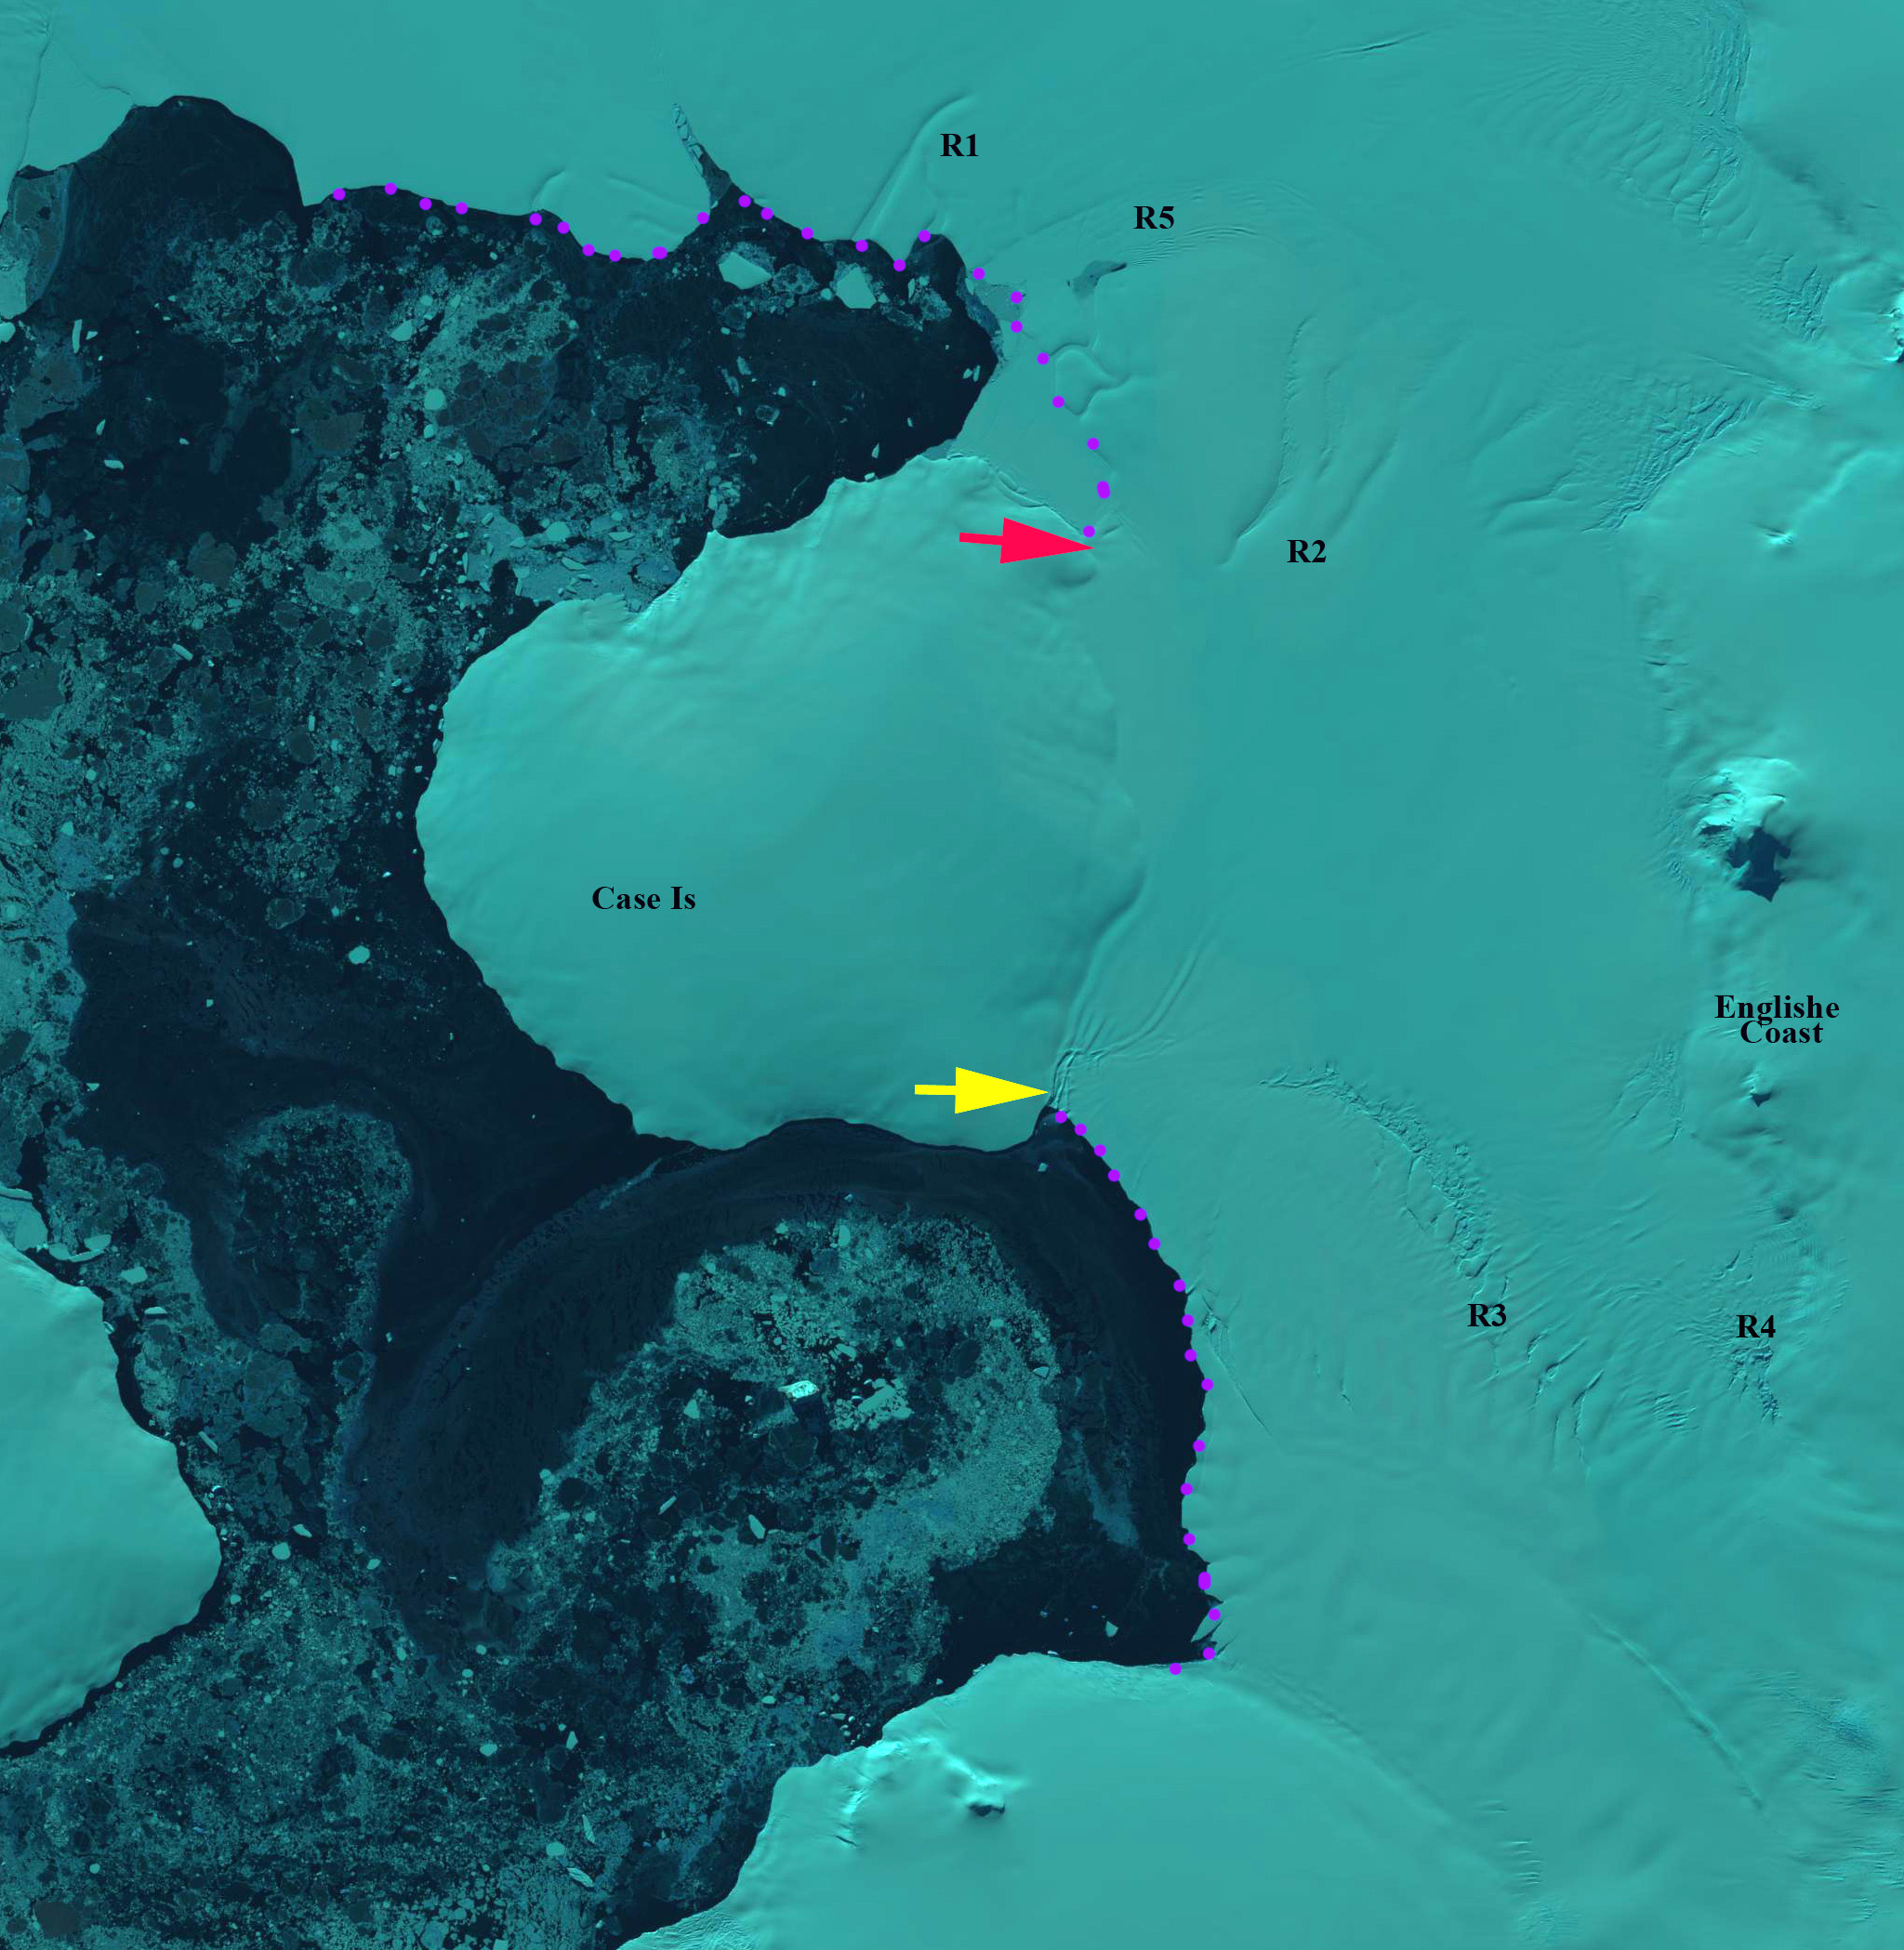
Stange Ice Shelf, Antarctica in 2016 Landsat image. Five rift zones are mentioned two by the southern ice front R3 and R4. Two by the central ice front R1 and R2. Purple dots mark ice front and yellow and red arrow the 1989 frontal positions on the north and south side of Case Island
Holt et al (2014) provide an exemplary examination of the dynamics from 1973 to 2011 of Stange Ice Shelf This ~8000 square kilometer ice shelf is at the base of the Antarctic Peninsula on its west side. With several ice shelf collapsing and indicating structural weakness, all should be examined, each will have a different story. They examined the ice shelf for the four key precursor symptoms of an ice sheet collapse. 1) Significant thinning due to surface or basal melt, which can structurally weaken the ice sheet. 2) Structural weakening along suture zones. 3) Sustained retreat and development of a concave front that has less connection to pinning points. 4) Increase in velocity. Examples where weakness is evident are en Verdi Ice Shelf, Wordie Ice Shelf and Jones Ice Shelf to the north. Here we use Landsat imagery from 1989, 2003 and 2016 to examine the south and central ice front, which illustrates what Holt et al (2014) concluded that the ice shelf is currently stable.

From Holt et al (2014)
The northern portion of the Ice shelf did lose 384 square kilometers between 1973 and 2011, while the southern and central ice front region each gained, a combined 48 square kilometers (Holt et al., 2014: Figure 2). Comparisons from 1989 to 2016 indicated very limited net ice front change from 1989 to 2016. The net change is 4% ice shelf area loss. In the case of the southern and central ice front there is not a sustained retreat. For velocity the net change in Holt et al (2014: Fig. 4) indicates only one area of significant acceleration, just southeast of Case Island and running just north and west of Rift zone R3. Just south of this zone and R3 was a zone of declining velocity. Surface elevation change was not consistent temporally or spatially. There was a net overall thinning of 0.17 m/year, a relatively minor amount (Holt et al, 2014: Fig. 5). This is a region dominated by basal melt ablation, which has been the key loss for most ice shelves (Pritchard et al 2012). A structural examination of rifting and suture zones indicated that most rifting had been persistent throughout the period. The exception was on the boundary of the accelerating and decelerating ice near R3, that occurred after 2001 when the iceberg noted calved. In 1989 this yet to be created iceberg has rifts that indicate it will soon calve, and in 2003 it has calved and moved from the calving front. For most rift areas there is little change from 1989 to 2003 to 2016, except for 3 where the degree of rifting has decreased. The overall assessment is that Stange Ice Shelf is currently stable, with none of the four precursor symptoms being widespread and significant spatially and temporally.
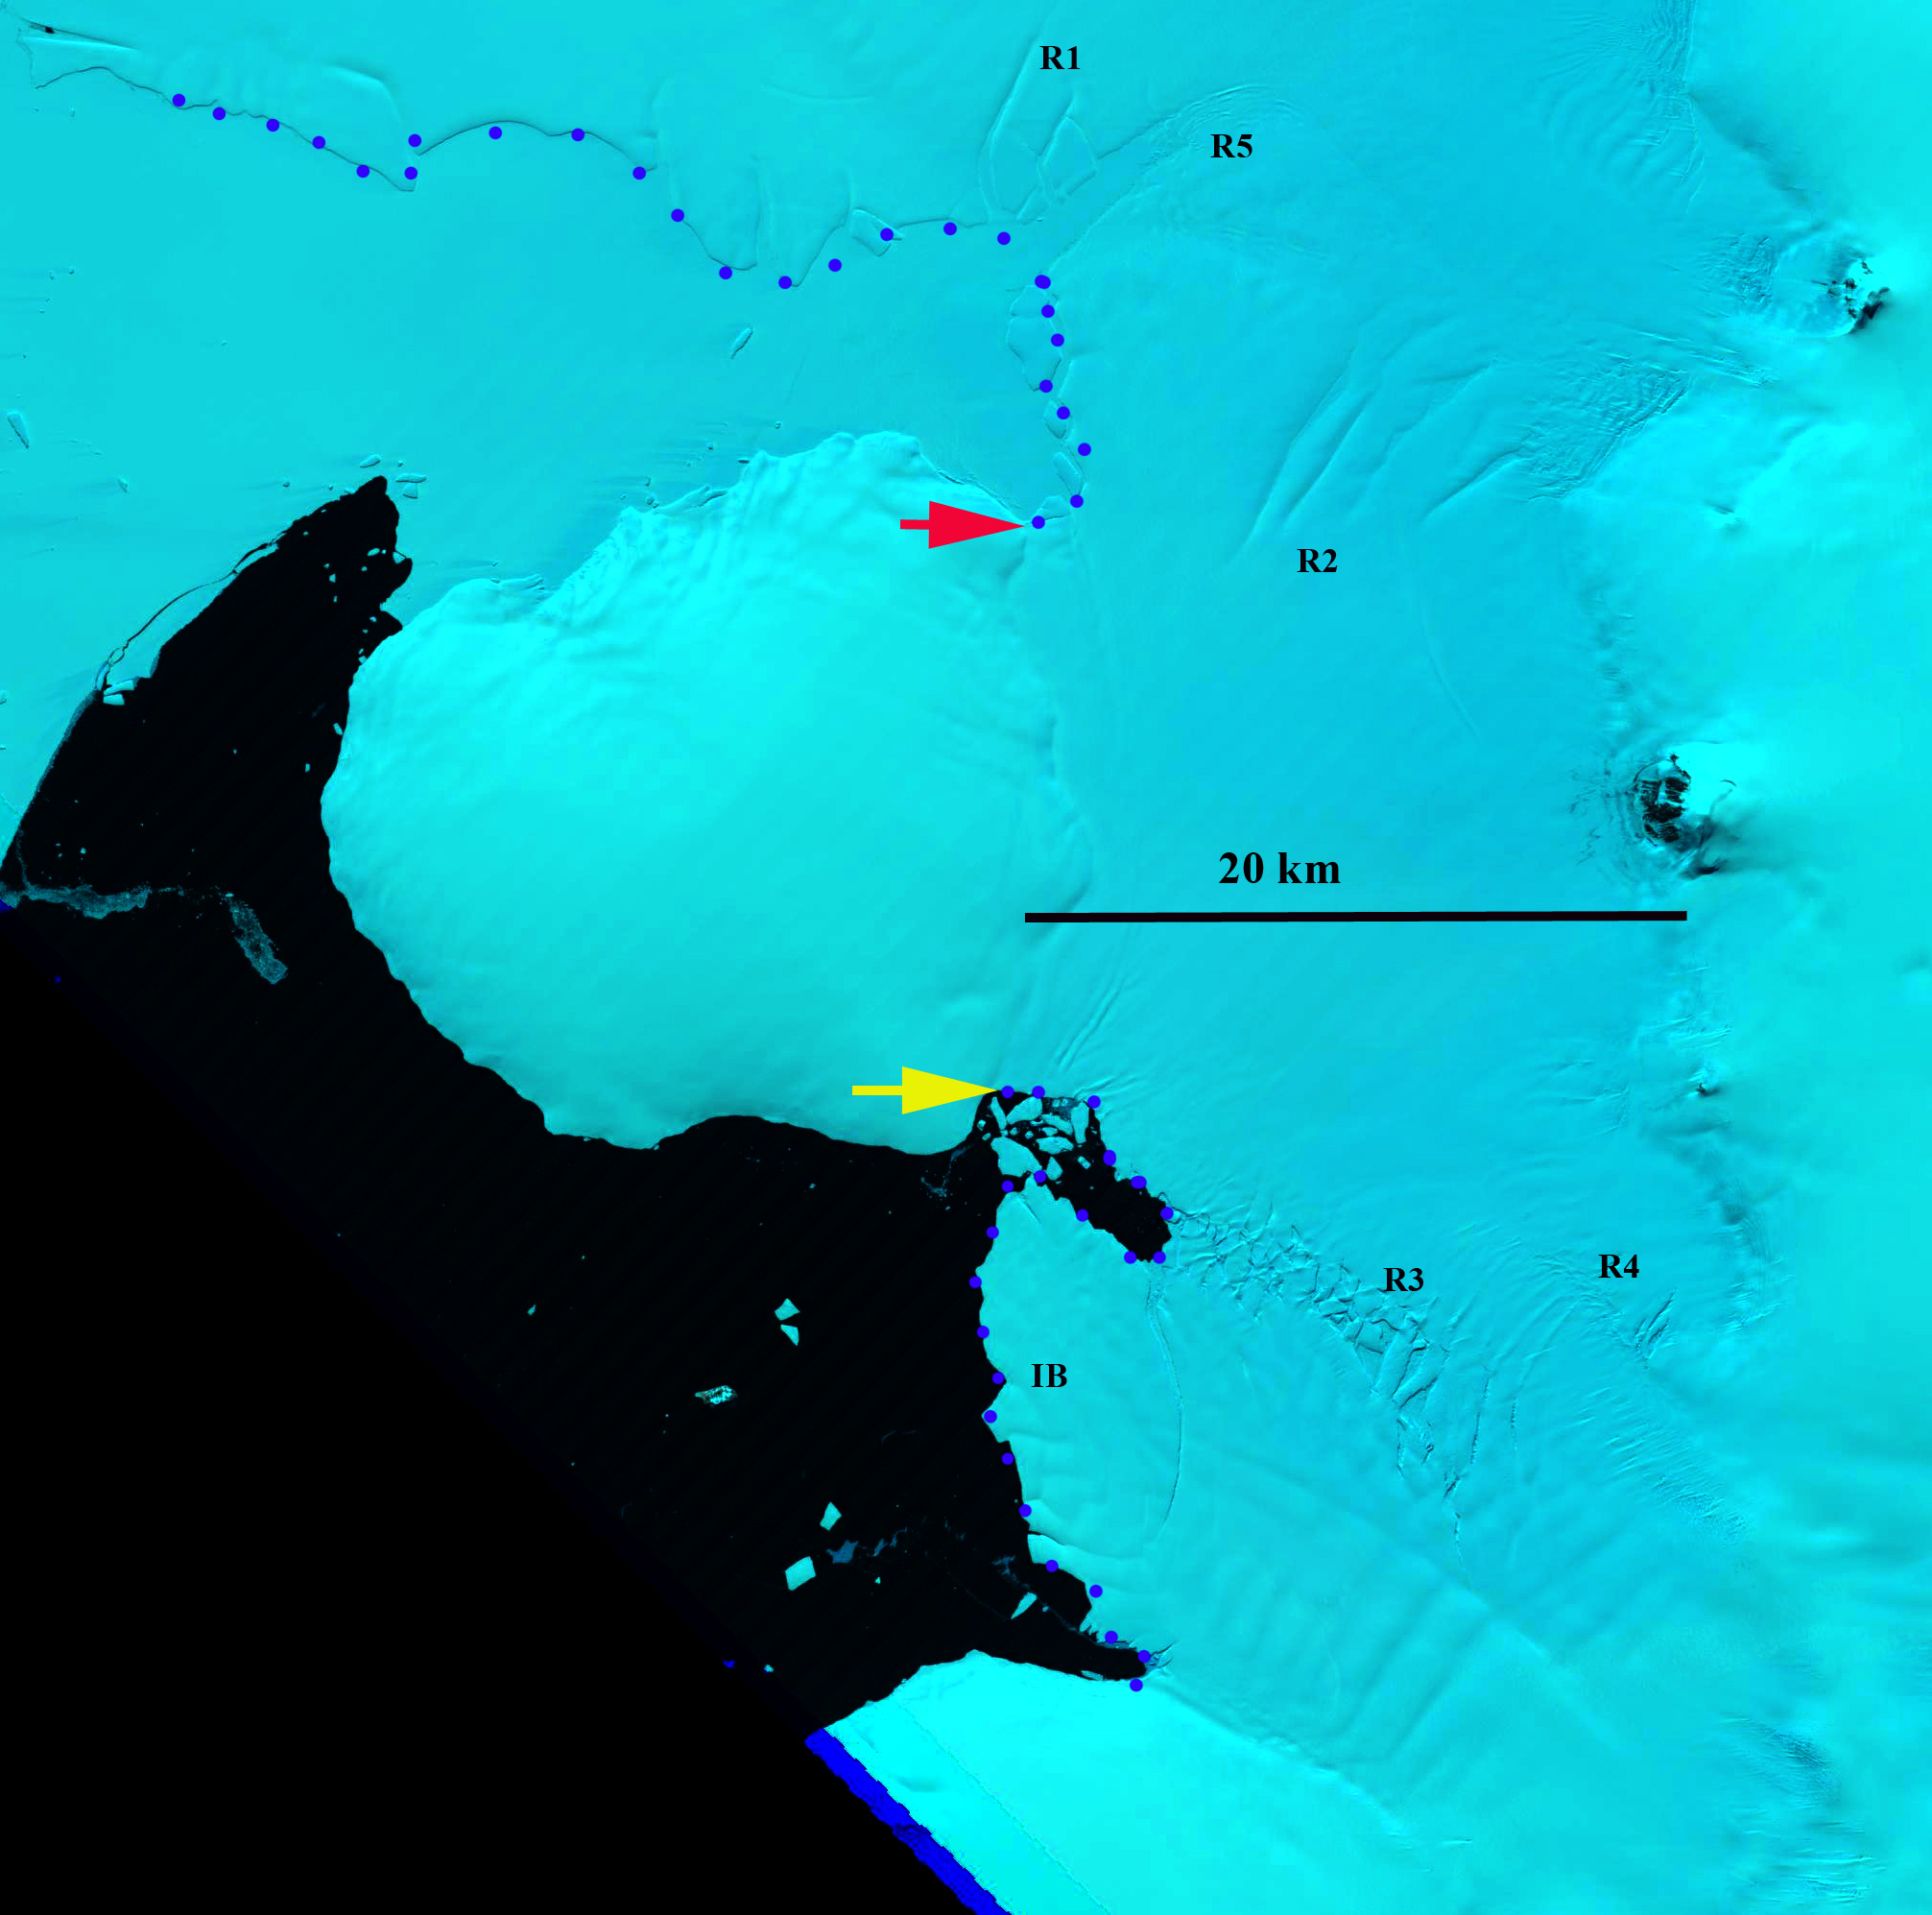
Stange Ice Shelf, Antarctica in 1989 Landsat image. Five rift zones are mentioned two by the southern ice front R3 and R4. Two by the central ice front R1 and R2. Purple dots mark ice front and yellow and red arrow the 1989 frontal positions on the north and south side of Case Island. IB= Ice berg that calves in 2001
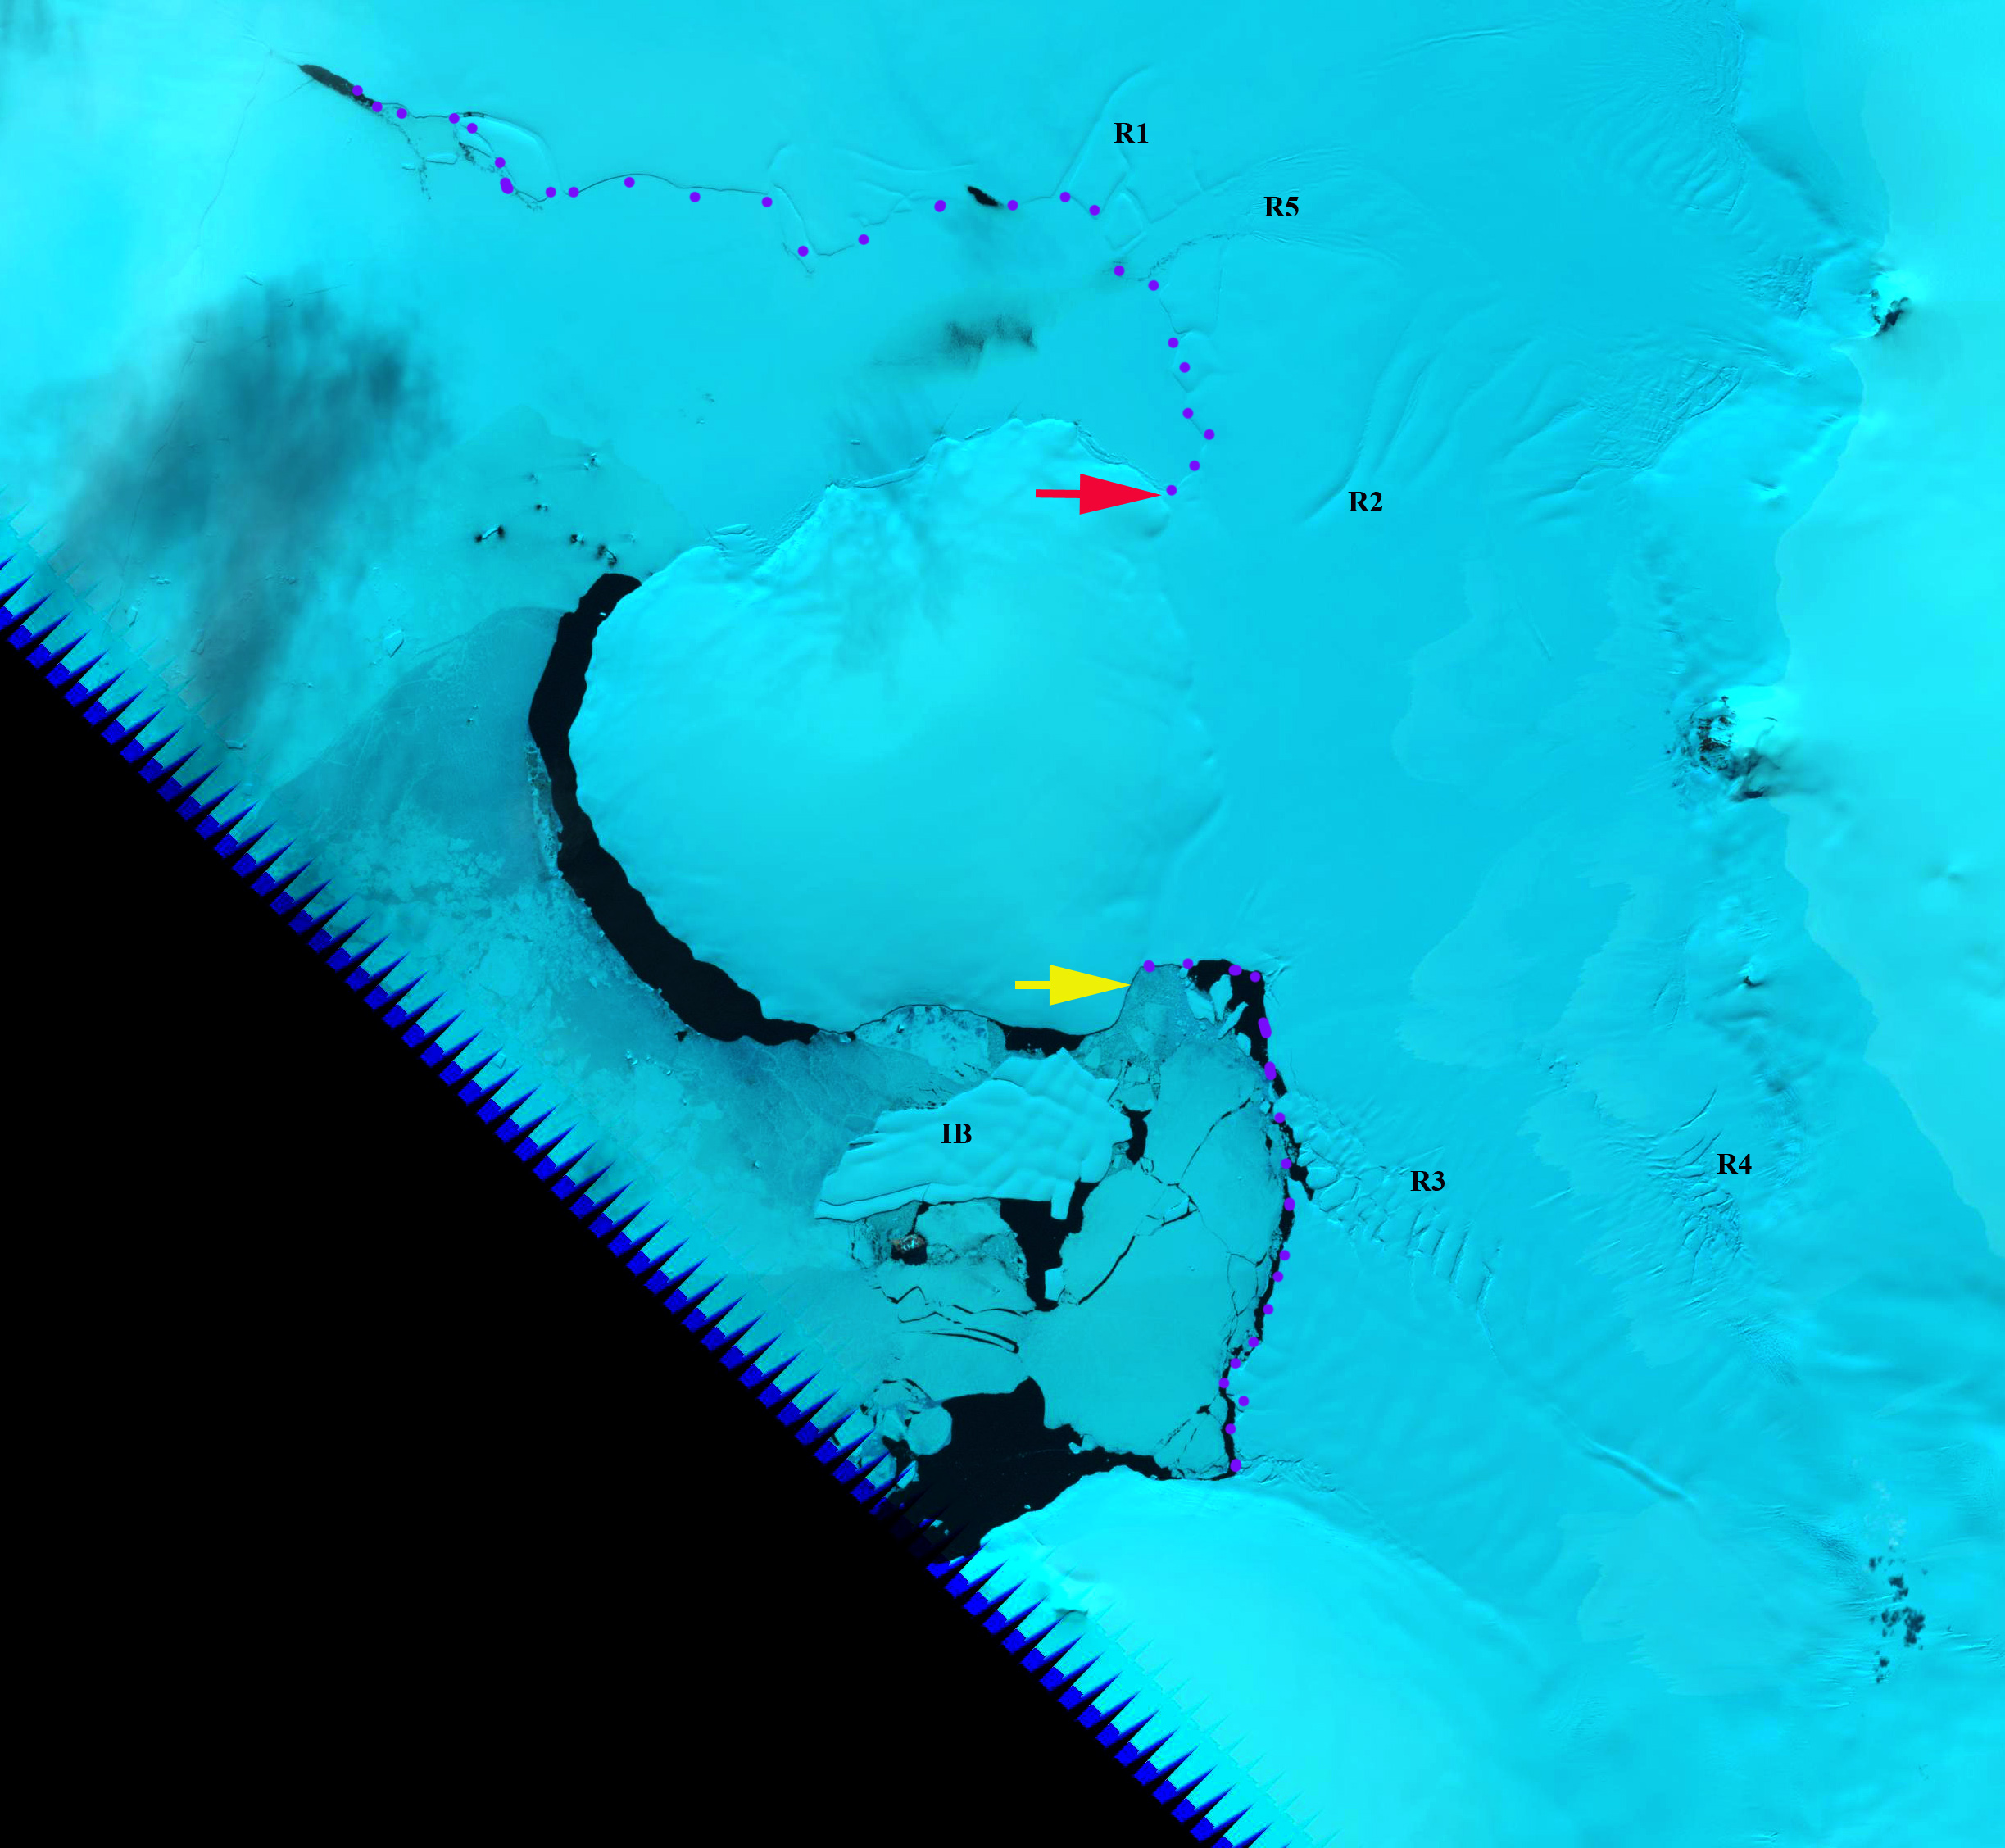
Stange Ice Shelf, Antarctica in 2003 landsat image. Five rift zones are mentioned two by the southern ice front R3 and R4. Two by the central ice front R1 and R2. Purple dots mark ice front and yellow and red arrow the 1989 frontal positions on the north and south side of Case Island. IB= Ice berg that calves in 2001
 Dean of Academic Affairs at Nichols College and Professor of Environmental Science at Nichols College in Massachusetts since 1989. Glaciologist directing the North Cascade Glacier Climate Project since 1984. This project monitors the mass balance and behavior of more glaciers than any other in North America.