February 19, 2016
Foss Glacier, WA Needs Snow Queen Elsa’s Help to Survive
Posted by Mauri Pelto
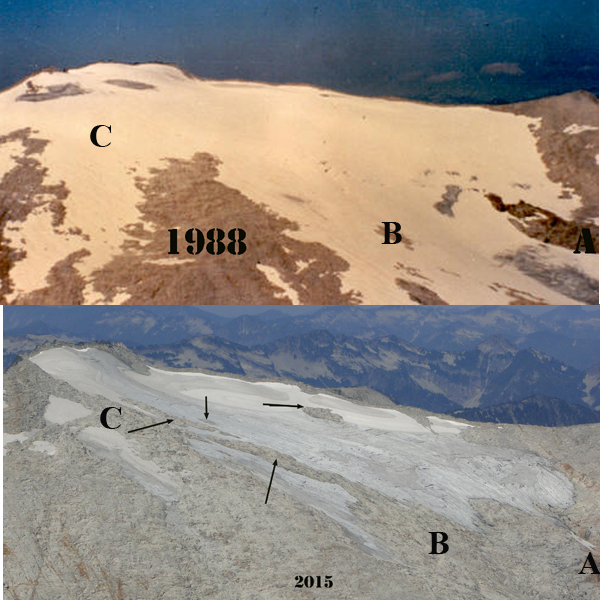
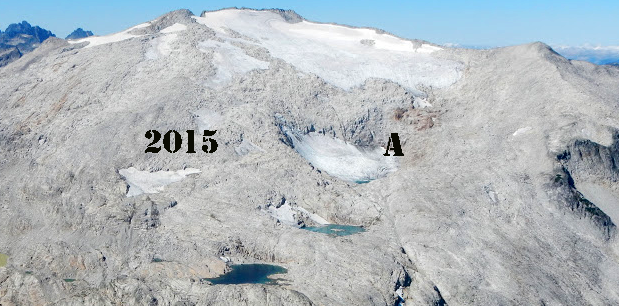
Comparison of Foss Glacier in 1988 and 2015 from the west ridge of Mount Daniel. The glacier has lost 70% of its area in 30 years. Black arrows indicate bedrock area emerging amidst the glacier.
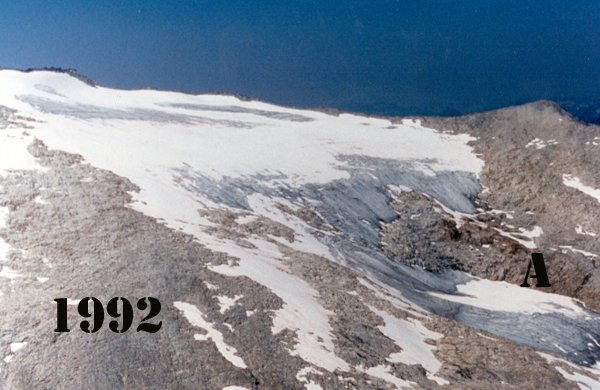
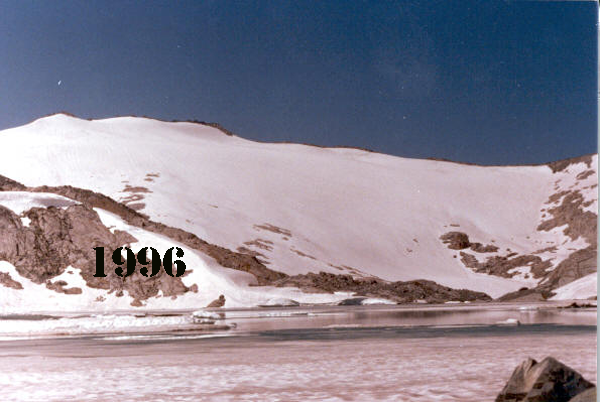
Foss Glacier is a slope glacier covering the northeast face of Mount Hinman at the head of the South Fork Skykomish River in the North Cascades of Washington. In the 1958 map of the region the glacier covered 0.8square kilometers. By 1984 when we first mapped the glacier margin the glacier had lost little area, and was at 0.7 square kilometers. In 1988 the glacier extended from 2325 m to 1890 m in one continuous swoop. Glacier thickness was in the 30-40 m range. There were few crevasses, and some of the supraglacial streams were particularly long for this region, 600 m is the longest mapped which was more than 50% of the glacier length. By 1992 the glacier was developing some significant bedrock outcrops emerging amidst the glacier. The terminus was retreating and the lower slope terminus lobe below 1950 m was clearly going to detach. Foss Glacier had by the middle of August lost all of its snowcover in 1992, 1993, 1994, 1998, 2003, 2005, 2009, 2014 and 2015. This has led to thinning of the upper reaches of the glacier. Thinning of the upper reaches of a glacier is an indicator of a glacier that cannot survive current climate. The lower section detached from the upper section in 2003 and melted away in 2015. In 2015 the glacier has fragmented into four parts and will continue to melt away. Annual balance measurements indicate a loss of over 18 meters of average ice thickness, which for a glacier that averaged 30-40 m in thickness represents approximately 50% of the volume of the glacier lost. In 2005 the glacier had lost 40% of its total area in 15 years, the terminus area had detached, Point A, and there was no snow retained (Pelto, 2015). This was the third straight year of almost no retained snowcover. A glacier cannot survive without a consistent/persistent accumulation zone, which is where snow is retained. A view of the changing area from the shore of Pea Soup Lake indicates how Foss Glacier in 1996 dominated the slope of Mount Hinman to 2007 when it did not. By 2015 after 30 years of mass balance measurement, the program was discontinued as the glacier had now lost 70% of its area in the previous 30 years. Unless Snow Queen Elsa can put the freeze on during summer, this glacier will not survive long.
The importance here is for late summer streamflow in the Skykomish River. Glacier retreat and changes in summer runoff have been pronounced in the Skykomish River Basin, North Cascades, Washington from 1950-2009 (Pelto, 2011). An analysis comparing USGS streamflow records for the 1950-1985 to the 1985-2009 period indicates that summer streamflow (July-September) has declined 26% in the watershed, spring runoff (April-June) has declined 6%, while winter runoff (November-March) has increased 10%. From 1929-1985 streamflow was less than 14 cubic meters/second during the glacier melt season on a single day in 1951. From 1986-2015 there were, 264 days with discharge below 14 m3/s-1 with 11 periods lasting for 10 consecutive days. The minimum mean monthly August discharge from 1928-2015 occurred in 2015, 2003 and 2005 when streamflow was 11.8 m3s-1, 15.1 m3s-1 and 15.2 m3s-1 respectively. Despite 15% higher ablation rates during the 1984-2009 period, the 45% reduction in glacier area led to a 35-38% reduction in glacier runoff between 1958 and 2009 (Pelto, 2011). The glacier runoff decline impacted river discharge only during low flow periods in August and September. In August, 2003 and 2005 glacier ablation contributed 1.5-1.6 m 3 s -1 to total discharge, or 10-11% of August discharge. While declining glacier area in the region has and will lead to reduced glacier runoff and reduced late summer streamflow, it has limited impact on the Skykomish River except during periods of critically low flow, below 14 m3 s -1 when glaciers currently contribute more than 10% of the streamflow.
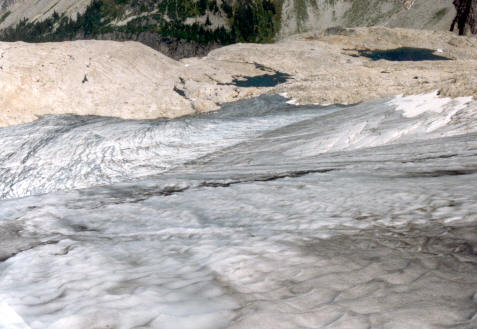
A 1992 view downglacier illustrating the limited crevassing, surface streams and thin nature of the ice.
Along a surface stream that has endured long enough to develop into a meandering system.
1992 view of Foss Glacier from Mount Daniel
By 2005 the glacier had separated into several segments and lost 30% of its area in the last 15 years. The terminus lobe was now detached. There is also no snow left.
1996 View of Foss Glacier across Pea Soup Lake
2007 View of Foss Glacier across Pea Soup Lake
2015 view of Foss Glacier from Mount Daniel.





 Dean of Academic Affairs at Nichols College and Professor of Environmental Science at Nichols College in Massachusetts since 1989. Glaciologist directing the North Cascade Glacier Climate Project since 1984. This project monitors the mass balance and behavior of more glaciers than any other in North America.