July 17, 2015
Alpine Glacier-BAMS State of the Climate 2014
Posted by Mauri Pelto
Each year I have the pleasure of writing the Alpine Glacier section of the BAMS State of the Climate report, which covers all aspects of climate during 2014 and is the most significant annual climate report published.. The report was published yesterday. Below is the section on Alpine Glaciers with some added figures. There was also a highlight section published by NOAA based on this section.
Alpine Glaciers – Mauri S. Pelto
The World Glacier Monitoring Service (WGMS) record of mass balance and terminus behavior (WGMS, 2015) provides a global index for alpine glacier behavior. Mass balance was -887 mm for the 37 long term reference glaciers and -653 mm for all monitored glacier globally in 2013, negative for the 26th consecutive year. Preliminary data for 2014 from Austria, Canada, Nepal, New Zealand, Norway, and United States indicate that 2014 will be the 27th consecutive year of negative annual balances with a mean loss of -853 mm for glaciers. Globally, the loss of glacier area is leading to declining glacier runoff. Since globally 370 million people live in river basins where glaciers contribute at least 10% of river discharge on a seasonal basis (Schaner et al, 2012) this requires continued efforts at monitoring.
Alpine glaciers have been studied as sensitive indicators of climate for more than a century, most commonly focusing on changes in terminus position and mass balance. The worldwide retreat of mountain glaciers is one of the clearest signals of ongoing climate change (Haeberli et al, 2000). Glacier mass balance is the difference between accumulation and ablation. The retreat is a reflection of strongly negative mass balances over the last 30 years (WGMS, 2013). The Randolph Glacier Inventory version 3.2 (RGI) was completed in 2014 compiling digital outlines of glaciers, excluding the ice sheets using satellite imagery from 1999-2010. The inventory identified 198 000 glaciers, with a total extent estimated at 726 800+34 000 km2 (Pfeffer et al, 2014). An earlier version (RGI 2.0) has been used to estimate global alpine glacier volume at ~150,000 Gt (Radic et al, 2014), quantifying the important role as a water resource and potential sea level rise contributor.
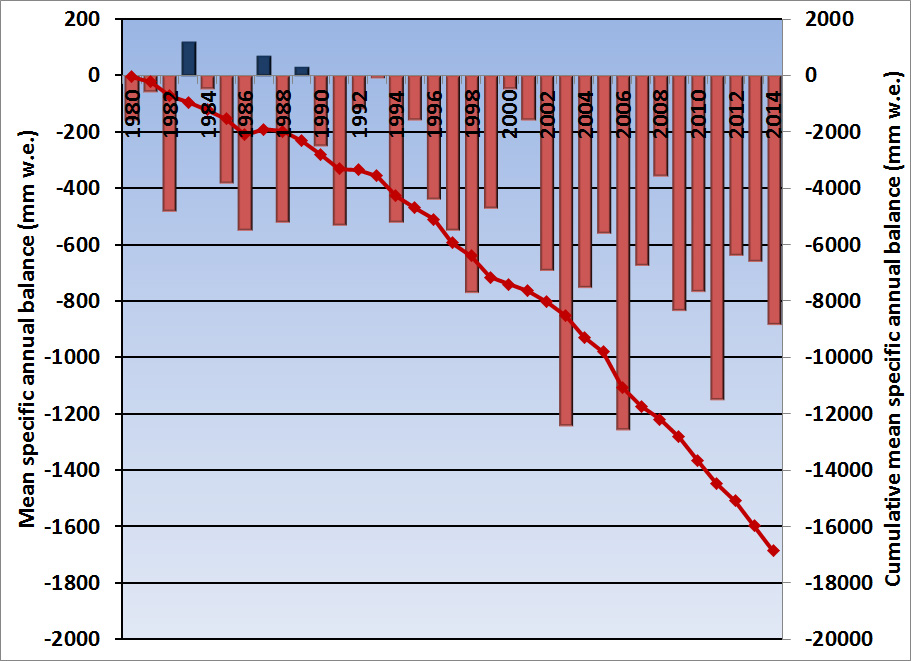
The cumulative mass balance loss since 1980 is 16.8 m water equivalent (w.e.), the equivalent of cutting a 18.5 m thick slice off the top of the average glacier (Figure 1). The trend is remarkably consistent from region to region (WGMS, 2013). WGMS mass balance results based on 37 reference glaciers with 30 years of record is not appreciably different, -16.4 m w.e. The decadal mean annual mass balance was -198 mm in the 1980’s, -382 mm in the 1990’s, and –740 mm for 2000’s. The declining mass balance trend during a period of retreat indicates alpine glaciers are not approaching equilibrium and retreat will continue to be the dominant terminus response. The recent rapid retreat and prolonged negative balances has led to some glaciers disappearing and others fragmenting (Pelto, 2010).
Annual mass balance of global glaciers submitted to the World Glacier Monitoring Service
In South America Argentina and Chile the mass balance of all six reported glaciers were negative with a mean of -1205 mm.
In the European Alps, mass balance has been reported for 11 glaciers from Austria, France, Italy and Switzerland, 10 had negative balances, with a mean of -454 mm w.e.. The European Alps experienced its warmest year (NOAA, 2015).
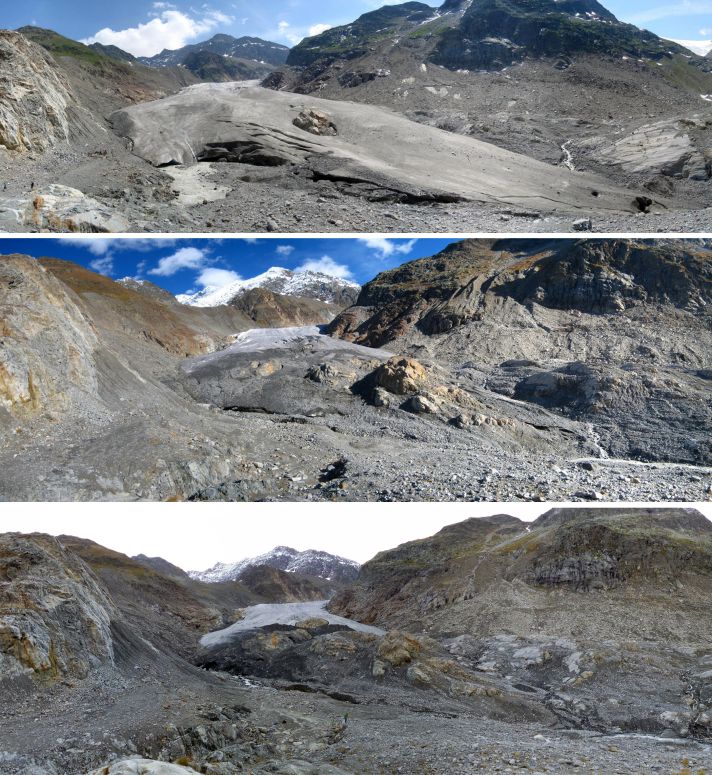
Gepatschferner Retreat 2012-2013-2014. Image from Austrian Alpine Club annual terminus survey report, Andrea Fischer.
In Norway terminus fluctuation data from 38 glaciers for 2014 with ongoing assessment indicate, 33 retreating, and 3 were stable. The average terminus change was -12.5 m (Elverhoi, 2014). Mass balance surveys with completed results are available for seven glaciers; all have negative mass balances with an average loss exceeding -1063 mm. In 2014 Norway experienced its warmest year (NOAA, 2015). In Iceland the mass balance of Hofsjokull was -970 mm. Svalbard was a location of positive mass balance with all four glaciers having a small positive mass balance.
In Washington and Alaska mass balance data from 13 glaciers indicate a loss of -1185 mm. In Washington the melt season was exceptional with the mean June-September temperature tied with the highest for the 1989-2014 period and had the highest average minimum daily temperatures. The result in the North Cascade Range, Washington was a significant negative balance on all nine glaciers observed, with an average of -1000 mm w.e. and, unsurprisingly, all experienced retreat. In Alaska all three glaciers with mass balance assessed had significant negative mass balances.
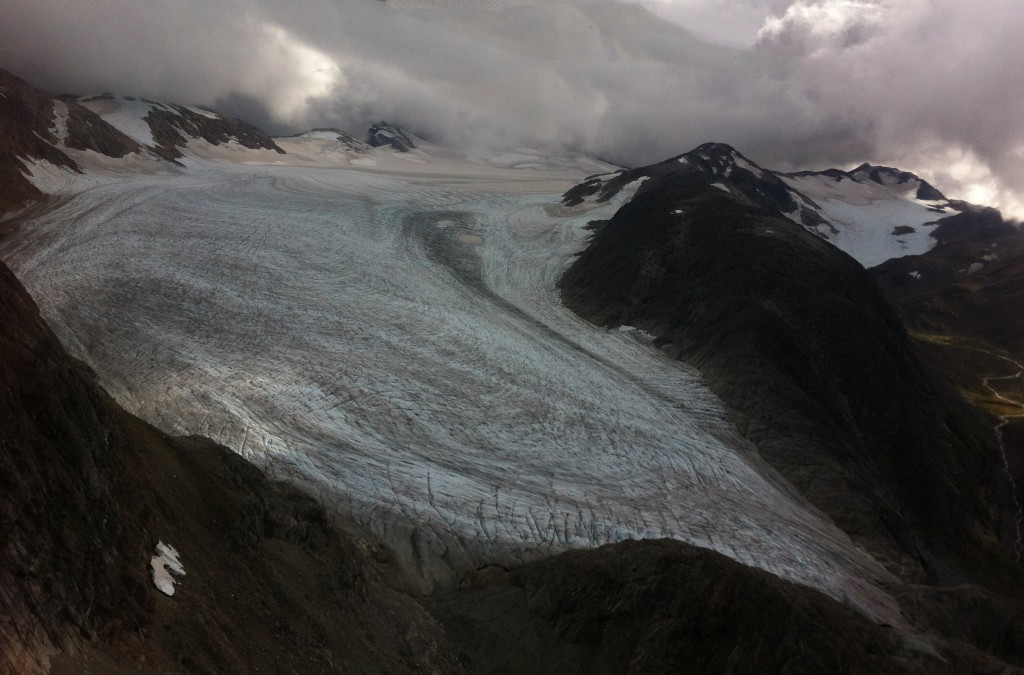
Lemon Creek Glacier, Alaska in 2014. Note the lack of snowpack in early September. The accumulation area ratio is 10 % coverage, and 62% coverage is needed for equilibrium. Picture taken by Chris McNeil
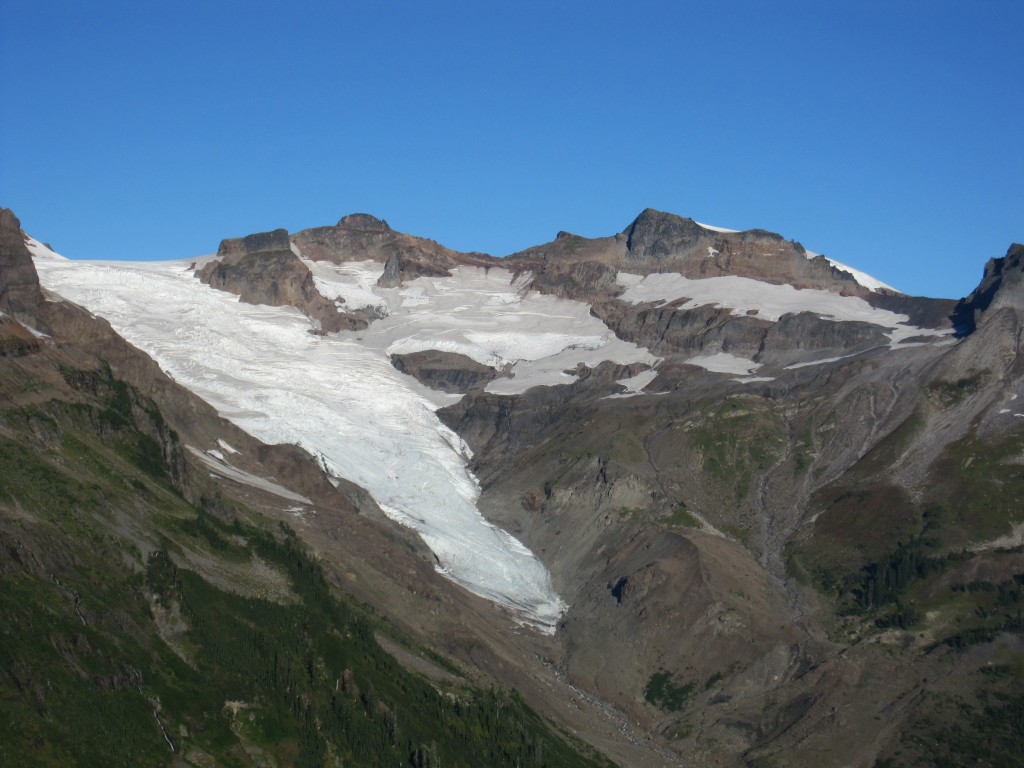
Rainbow Glacier September 2015, lack of snowcover again evident.
In the high mountains of central Asia five glaciers from four nations reported data were negative with a mean of -870 mm. Gardelle et al (2013) noted that mean mass balance in the eastern and central Himalaya was -275 mma-1 and losses in the western Himalaya were 450 mma-1 during the last decade.
References
Carturan, L., Baroni, C., Becker, M., Bellin, A., Cainelli, O., Carton, A., Casarotto, C., Dalla Fontana, G., Godio, A., Martinelli, T., Salvatore, M. C., and Seppi, R. 2013: Decay of a long-term monitored glacier: Careser Glacier (Ortles-Cevedale, European Alps). The Cryosphere, 7, 1819-1838, doi:10.5194/tc-7-1819-2013.
Elverhoi, H., 2014: Norwegian water resources and energy directorate 2013 glacier length change Table. http://www.nve.no/en/Water/Hydrology/Glaciers/
Fischer, A. 2013: Gletscherbericht 2012/2013. http://www.alpenverein.at/portal/news/aktuelle_news/2015/2015_04_03_gletscherbericht.php
Gardelle, J., Berthier, E., Arnaud, Y., and Kääb, A.: Corrigendum to “Region-wide glacier mass balances over the Pamir-Karakoram-Himalaya during 1999–2011” published in The Cryosphere, 7, 1263–1286, 2013, The Cryosphere, 7, 1885-1886, doi:10.5194/tc-7-1885-2013, 2013.
Haeberli, W., J. Cihlar and R. Barry 2000: Glacier monitoring within the Global Climate Observing System. Ann. Glaciol, 31, 241-246.
NOAA, 2015: State of the Climate: Global Analysis-2014: http://www.ncdc.noaa.gov/sotc/global/.
Pelto, M. 2010: Forecasting temperate alpine glacier survival from accumulation zone observations. The Cryosphere, 4, 67–75.
Pfeffer, W.T., and the Randolph Consortium 2014: The Randolph Glacier Inventory: a globally complete inventory of glaciers, J. Glaciol., 60 (221), 537-551 (doi: 10.3189/2014JoG13J176)
Radic´ V, Bliss A, Beedlow AC, Hock R, Miles E and Cogley JG (2014) Regional and global projections of twenty-first century glacier mass changes in response to climate scenarios from global climate models. Climate Dyn., 42(1–2), 37–58 (doi: 10.1007/s00382-013-1719-7)
Schaner, N., Voisin, N., Nijssen, B. and Lettenmaier, D. 2012: The Contribution of Glacier Melt to Streamflow. Environmental Research Letters 7 (doi:10.1088/1748-9326/7/3/034029.
WGMS, 2013: Glacier Mass Balance Bulletin No. 12 (2010–2011). Zemp, M., Nussbaumer, S. U., GärtnerRoer, I., Hoelzle, M., Paul, F., and Haeberli, W. (eds.), ICSU(WDS)/IUGG(IACS)/UNEP/UNESCO/WMO, World Glacier Monitoring Service, Zurich, Switzerland.
WGMS, 2015: Latest Glacier Mass Balance data. http://www.geo.uzh.ch/microsite/wgms/mbb/sum13.html


 Dean of Academic Affairs at Nichols College and Professor of Environmental Science at Nichols College in Massachusetts since 1989. Glaciologist directing the North Cascade Glacier Climate Project since 1984. This project monitors the mass balance and behavior of more glaciers than any other in North America.
[…] this is compared to the loss in the 1980’s and 1990’s 25 cm and 40 cm respectively each year (Pelto, 2015). A comparison of the global and North Cascade Glacier mass balance records since 1980 indicate […]
[…] In a recent paper published in the Journal of Glaciology spearheaded by the WGMS group (M. Zemp, H. Frey, I.Gartner-Roer, S.Nussbaumer, M.Hoelzle, F.Paul, W.Haeberli and F.Denzinger), that I was co-author on, we examined the WGMS dataset on glacier front variations (~42 000 observations since 1600), along with glaciological and geodetic observations (~5200 since 1850). The data set illustrated that “rates of early 21st-century mass loss are without precedent on a global scale, at least for the time period observed and probably also for recorded history.The rate of melting has been accelerating, and in the decade from 2001 to 2010, glaciers lost on average 75 centimetres of their thickness each year”, this is compared to the loss in the 1980’s and 1990’s 25 cm and 40 cm respectively each year (Pelto, 2015). […]
[…] this is compared to the loss in the 1980’s and 1990’s 25 cm and 40 cm respectively each year (Pelto, 2015). A comparison of the global and North Cascade Glacier mass balance records since 1980 indicate […]