
September 30, 2014
Whitney Glacier Retreat and Thinning, Mount Shasta, California
Posted by Mauri Pelto
Mount Shasta is a stratovolcano home to the largest glaciers in California. Of the seven glaciers on the mountain Whitney Glacier on the north side is the longest. The last two years 2013 and 2014 have seen hot dry summers separated by a dry winter in 2013/14, see below, how are the glaciers responding? In 1981 USGS (Driedger and Kennard, 1986) mapped the area and volume of several of the glaciers, in a landmark study of glacier volume on Cascade volcanoes. Whitney Glacier had an area of 1.3 square kilometers, a maximum depth of 38 m, and a volume of 25 million cubic meters. The majority of the glacier is in the 25-35 m thick range. The glacier was noted as having a length of 3.0 km ending on the USGS map at 9900 feet. Mass balance losses exceeding 1 m/year as has been the case in recent years, results in significant volume loss.
January satellite image of Mount Shasta’s limited snowpack
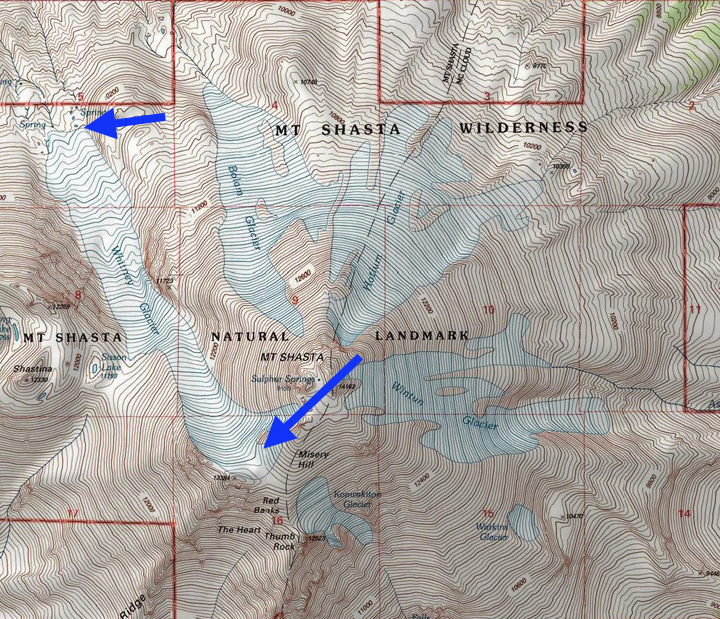
Topographic map of Mt. Shasta.
A UCSC study looking at the change in the glaciers from 1944 to 2003 noted an expansion of the Mount Shasta glaciers that when published in 2008 was in contrast to most alpine glaciers globally or in the Pacific Northwest. Tulaczyk and Howat (2008) noted that Whitney Glacier had advanced 850 m since 1951 to 2003, but when did retreat begin? There was a period of advance for many Cascade volcanoes glaciers between 1950 and 1980, but retreat after. For example on Mount Baker all of the glaciers advanced during the 1944-1979 period by an average of 480 m (Pelto and Hedlund, 2001). By 2010 Pelto and Brown (2012) observed all were retreating with an average retreat of 370 m. In 2003 all of them all had retreated , but many were in advance of their 1944 position. By 2014 the retreat has exceeded the advance from 1944 on most Mount Baker glaciers, more on this in the next post. This is an important point for Mount Shasta too, Whitney Glacier was advancing in 2003 but had been retreating in the late 1980’s and 1990’s. Whitney Glacier was further advanced than in 1944, but how short lived was the advance? Here we examine satellite images from 1987 to 2014 to identify recent trends, along with Google Earth imagery of termini of several glaciers and the 1981 USGS observations.
The first sequence is a 1987, 2013 and 2014 Landsat image with a pink arrow at the top of Whitney Glacier indicating the expansion of bare rock at the head of the glacier. The purple arrow is at the 1987 terminus, which indicates some retreat and also thinning by 2013.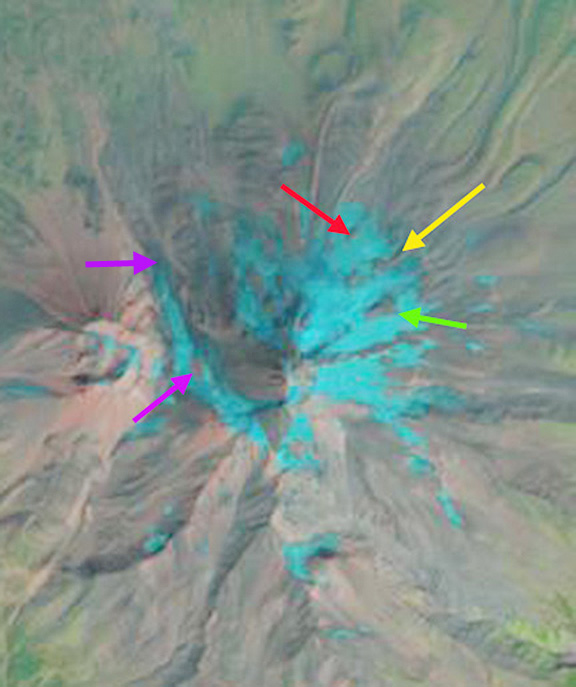
1987 Landsat image
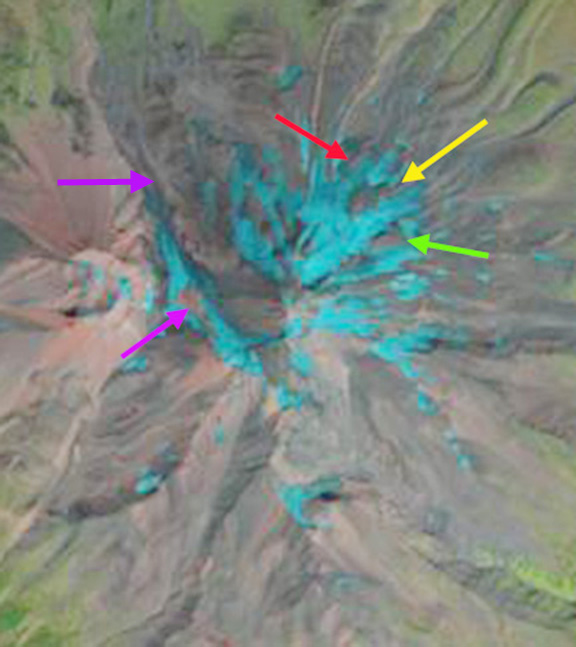
2013 Landsat image

2014 Landsat image
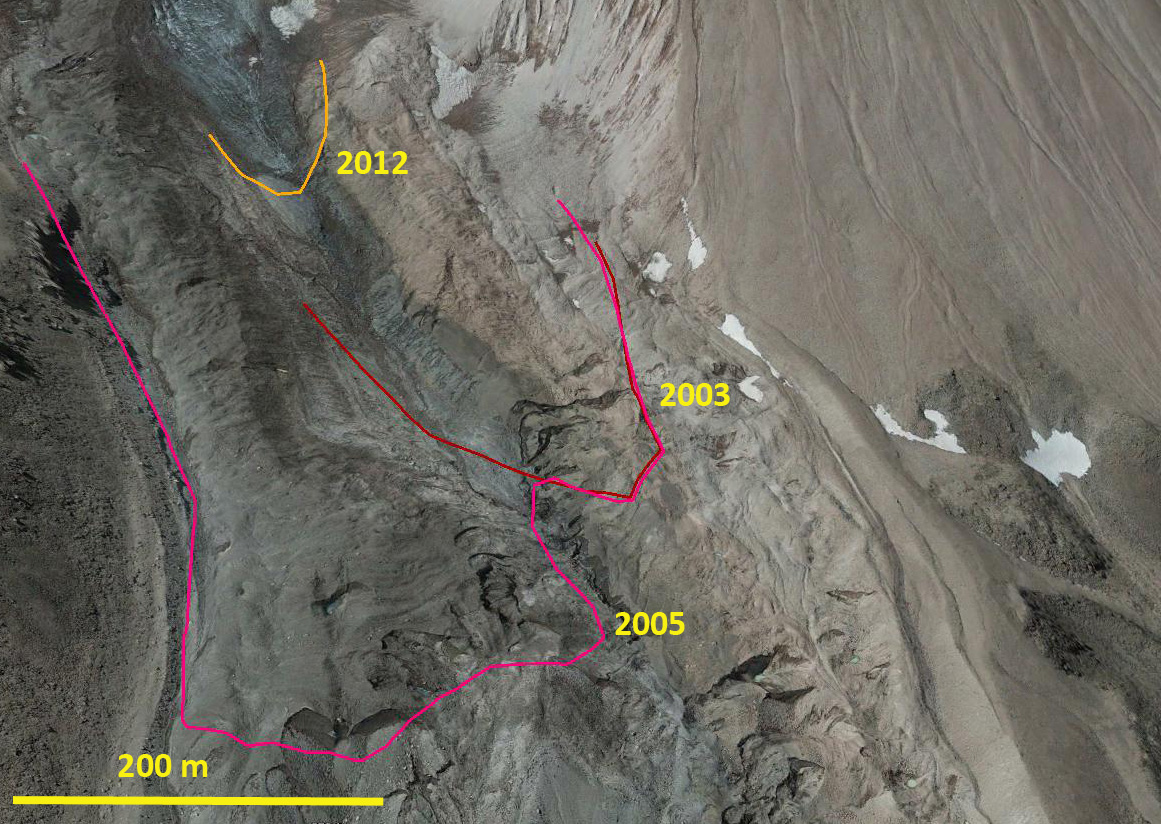
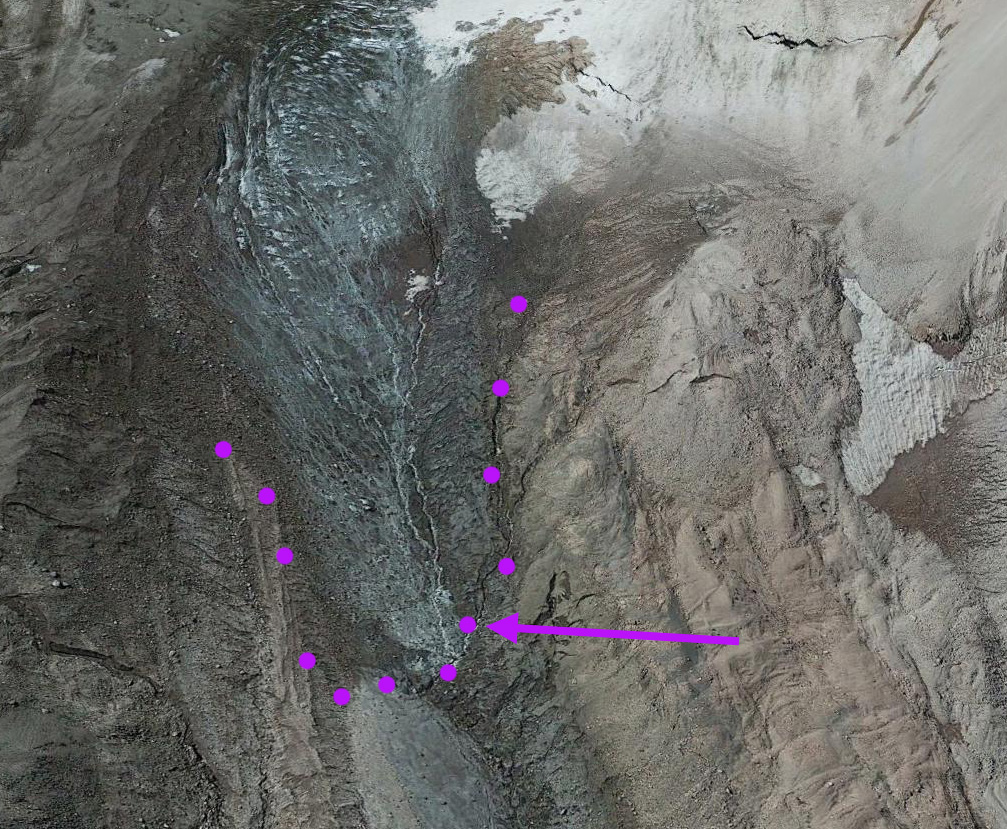
In between 1987 and 2013 of course was the period of advance and then retreat that is examined in the second sequence of images from Google Earth of the glacier in 1993, 2003, 2005, 2012 and 2014. It is evident that the glacier did expand between 1993 and 2005, as Tulaczyk and Howat (2008) had noted the advance period was unusual. The advance was likely limited to the 1999-2005 period due to heavy snowfall from 1998-2002. The 2005 terminus is quite near the 1981 terminus position indicating a period of retreat in the 1980’s and 1990’s. In 2003 and 2005 there is extensive crevassing at the blue arrows. The glacier terminus margin is indicated by a red line for 2003, pink line for 2005 and orange line for 2012 and green for 2014. It is evident that the zone of heavy crevassing and significant ice motion in 2003 and 2005 is in the vicinity of the 2012 terminus. By 2012 and 2014 the glacier is thin in its lower reaches with no crevassing. This indicates the retreat will be continuing. By 2014 the terminus of the glacier had retreated 700 m from 2005 and is now 2.6 km in length and terminates at 10,200 feet, 400 feet higher than a decade before or in the 1981 map. A closeup of the terminus in 2012 indicates the thin uncrevassed nature with surface streams incised into the ice. There are some areas of ice cored moraine beyond the current terminus.
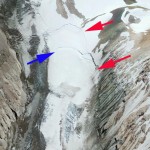
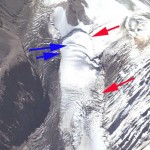
The retreat of glaciers on Mount Shasta leads to thinner ice and lower velocities, but can also lead to ice failure and avalanching, along with more subglacial melt pockets-caves developing. This is likely beyond the recent small outburst flood on Mt, Shasta. The reduced velocity high on Whitney Glacier is evident from observations of a key crevasse set higher on the glacier beginning at an elevation of 11700 feet. The red arrows point out what is a bergshrund along most of its length separating the glacier from the surrounding non-glacier snowfields. The blue arrows indicate crevasses below the bergshrund. Note that the vertical and horizontal offset of the bergshrund had declined from 1998 to 2014, and the number and extent of the crevasses has also declined. Both indicate reduced acceleration and velocity.

1993 Google earth image

2003 Google Earth image

2005 Google Earth image
2012 Google Earth Image

2014 Google Earth image
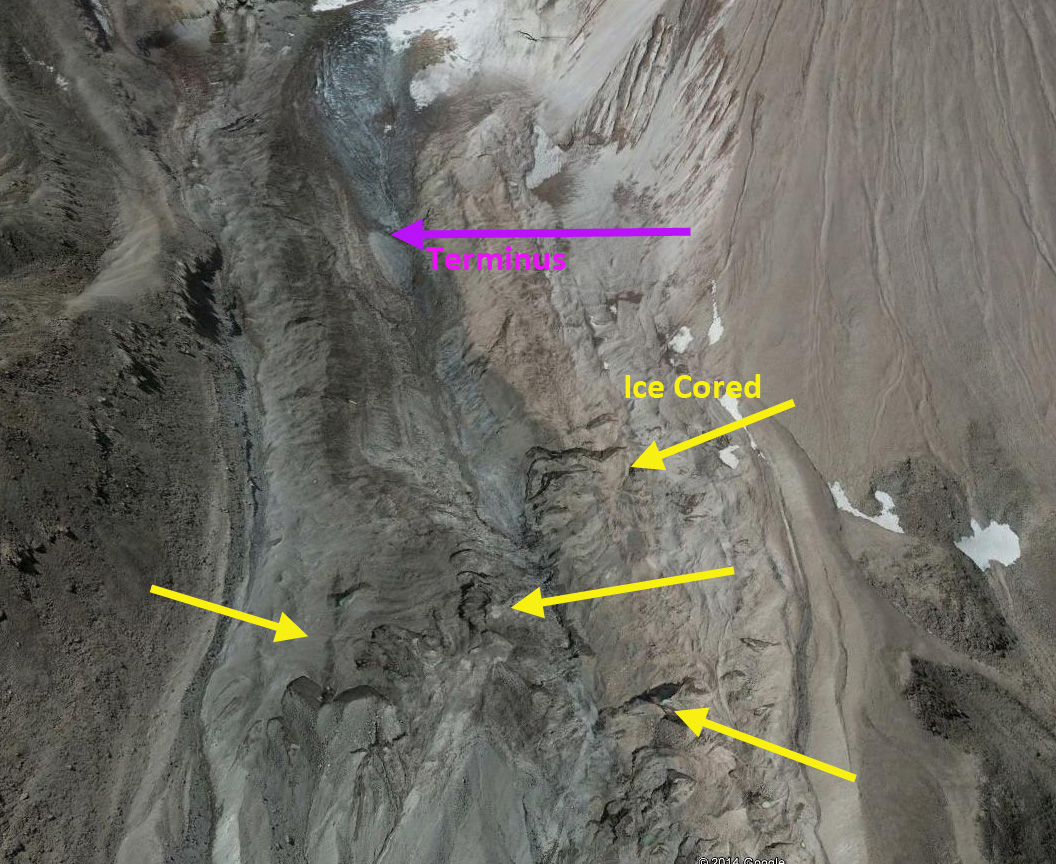
2014 Terminus closeup
2014 Ice Cored moraine areas
-
- 2005 Google Earth Image
-
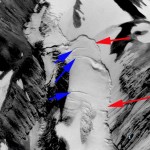
- 1998 Google Earth image
 Dean of Academic Affairs at Nichols College and Professor of Environmental Science at Nichols College in Massachusetts since 1989. Glaciologist directing the North Cascade Glacier Climate Project since 1984. This project monitors the mass balance and behavior of more glaciers than any other in North America.