
May 6, 2014
Nooksack River Glacier Runoff Importance
Posted by Mauri Pelto
If glaciers did not change in response to climate, we would not have to think about their role in water resources in the watersheds that they reside. During the last two years in an ongoing study with the Nooksack Indian Tribe we have been working on quantifying the role glaciers play in that watershed. Glaciers comprise the headwaters of the Nooksack River and are a critical source of summer discharge and greatly influence summer stream temperatures. There are nine species of salmon in the watershed that the Nooksack Indian Tribe depends on for cultural, subsistence, and economic uses. Climate change is an additional new threat to salmon that has caused and will continue to cause an increase in winter flow, decreased summer baseflow, and increased summer water temperatures. 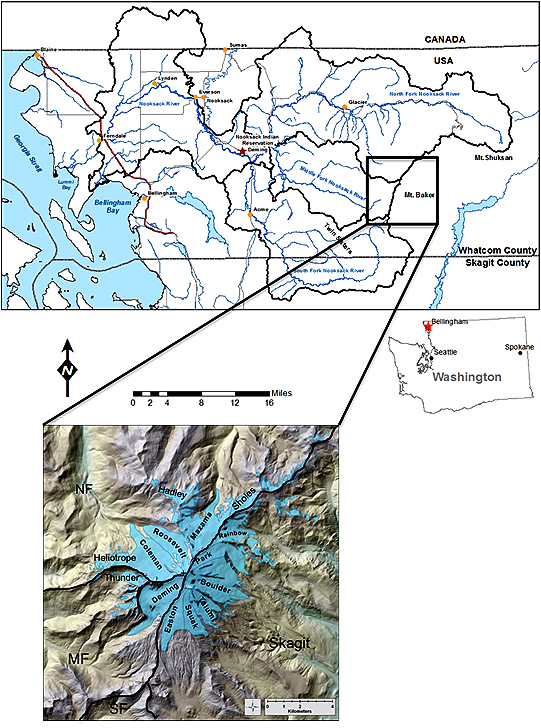
This post will focus on the changing impact of glaciers on streamflow and the evolving water temperature threat. The Nooksack River watershed has three significant watersheds, South Fork, Middle Fork and North Fork. The South Fork has no glaciers, the Middle Fork has four significant glaciers and 2% of the watershed area above the USGS gage is glaciated. The North Fork has 12 significant glaciers that cover 6% of the watershed area above the USGS gage. Here we examine stream discharge and water temperature at USGS gages on each stream to illustrate the different response to 12 warm weather events during the summers of 2009, 2010, 2012 and 2013. During each of these periods we have along with Oliver Grah and Jezra Beaulieu, working for the Nooksack Tribe, have been observing the ablation and runoff directly from the glaciers. The largest area of glaciers are those on Mount Baker, a strato volcano that is the highest mountain in the North Cascades. Pelto and Brown (2012) note that terminus observations on the nine principal Mount Baker glaciers, 1984–2009, indicate retreat ranging from 240 to 520 m, with a mean of 370 m or 14 m/year. Pelto and Brown (2012) observed that this is the result of a sustained mass balance loss averaging -0.5 m/year during the 1990-2010 period. This equates to an 11-m loss in glacier thickness, 12–20% of the entire 1990 volume of glaciers on Mount Baker. This summer we will for the 31st consecutive year be measuring glacier mass balance on Mount Baker.
-

- Mazama Glacier headwaters North Fork
-

- Deming Glacier headwaters Middle Fork
-

- Crevasse examination
-

- Probing snow depth
-

- Outlet of Sholes Glacier, North Fork
-

- Measuring snow depth in crevasse
During each of these events ablation was measured on glaciers in the basin. For stream discharge, a 10% increase is set as the key threshold for significant response to each warm weather event. For the North Fork 10 of 12 warm weather events exceeded the limit, in the Middle Fork 4 of 12 events had a significant response and for the South Fork none of the 12 events led to a 10% flow increase. It is apparent that warm weather events increase glacier melt, thus enhancing flow in the North Fork. In a basin without glacier runoff the hydrologic system consistently experiences reduced discharge.
For water temperature, an increase of 2° C is the threshold of significance used for response to warm weather events. In each the North Fork and Middle Fork, 2 of 12 events exceeded this threshold, and for the South Fork 12 of 12 events exceeded this threshold, each event is a green ellipse on the charts below. Warm weather events consistently generate a significant increase in stream water temperature only in the non-glaciated South Fork Basin. During 6 of these 12 warm events, runoff measurements below Sholes Glacier and ablation measurements on Sholes and Easton Glacier indicate daily ablation ranging from 0.05-0.06 meters per day, which for the North Fork currently yields 9.5-11 m3/second. This is 40-50% of the August mean discharge of 24 m3/second, despite glaciers only covering 6% of the watershed. Increased glacier discharge largely offset the impact of increased air temperature on stream water temperature during the warm weather events. In the charts below note the red line with diamond markers that is the South Fork stream temperature and the top brightest blue line that is North Fork discharge and what happens during the warm events, green ellipses. Also note the South Fork discharge bottom blue line does not respond nor does the North Fork stream temperature red line with triangles.
As the glaciers continue to retreat the North Fork will trend first toward the more limited impact of the Middle Fork and then the highly sensitive South Fork where warm weather leads to declining streamflow and warming temperatures. This will lead to a situation similar to the Skykomish River where the number of low flow days has sharply increased. The retreating glaciers include the Sholes, Roosevelt,Deming and Mazama. 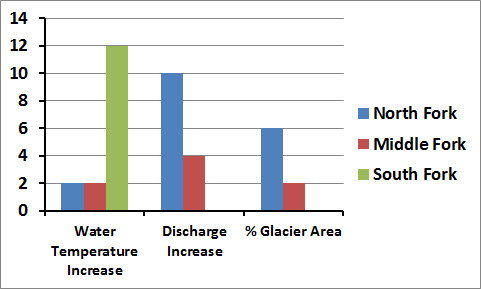
Number of the 12 warm weather events with increased discharge, increased water temperature and the percent of glaciation in each basin
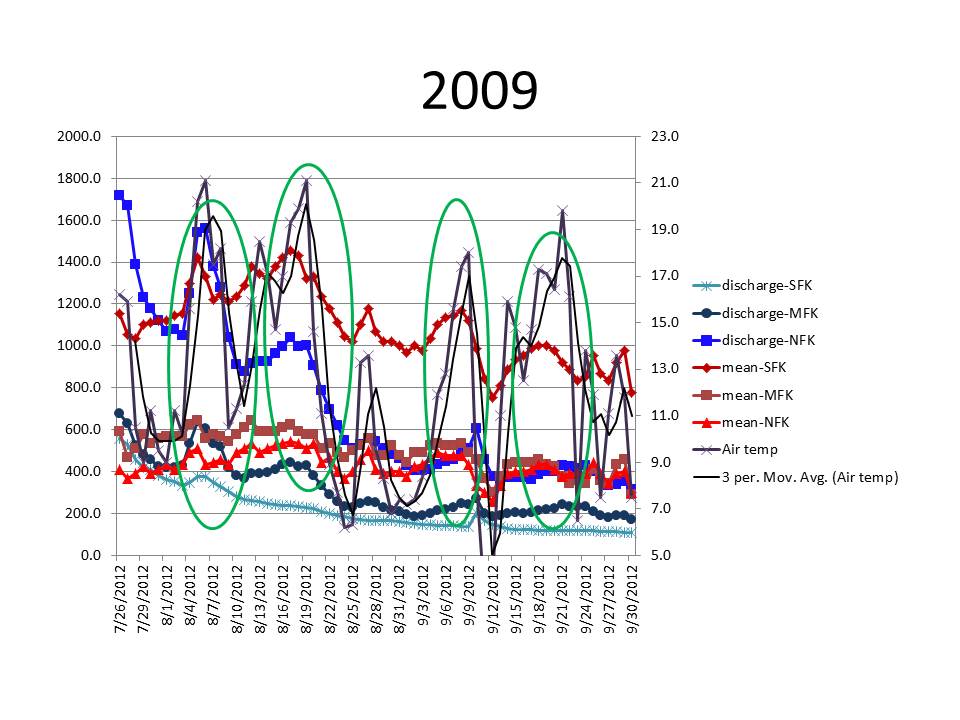
Streamflow and water temperature in the Nooksack in Summer 2009
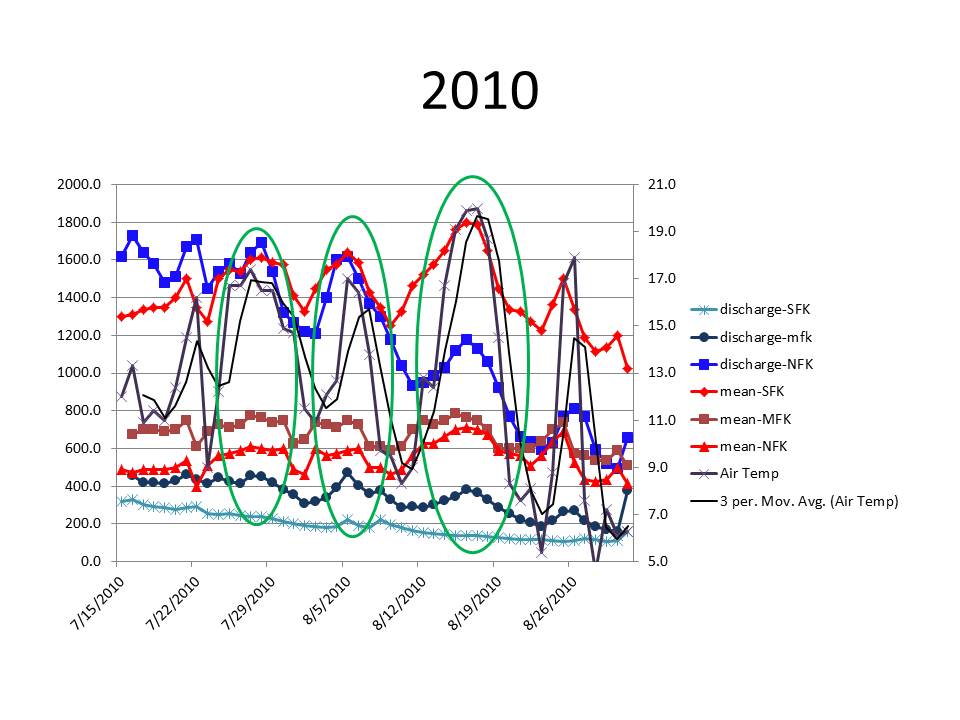
Streamflow and water temperature in the Nooksack in Summer 2010
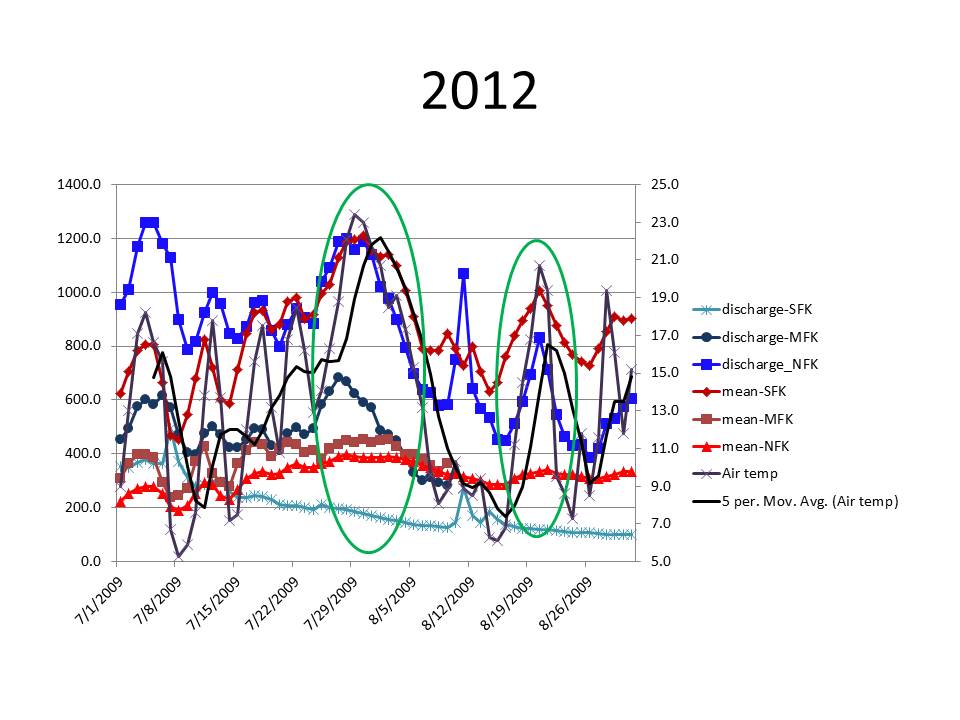
Streamflow and water temperature in the Nooksack in Summer 2012
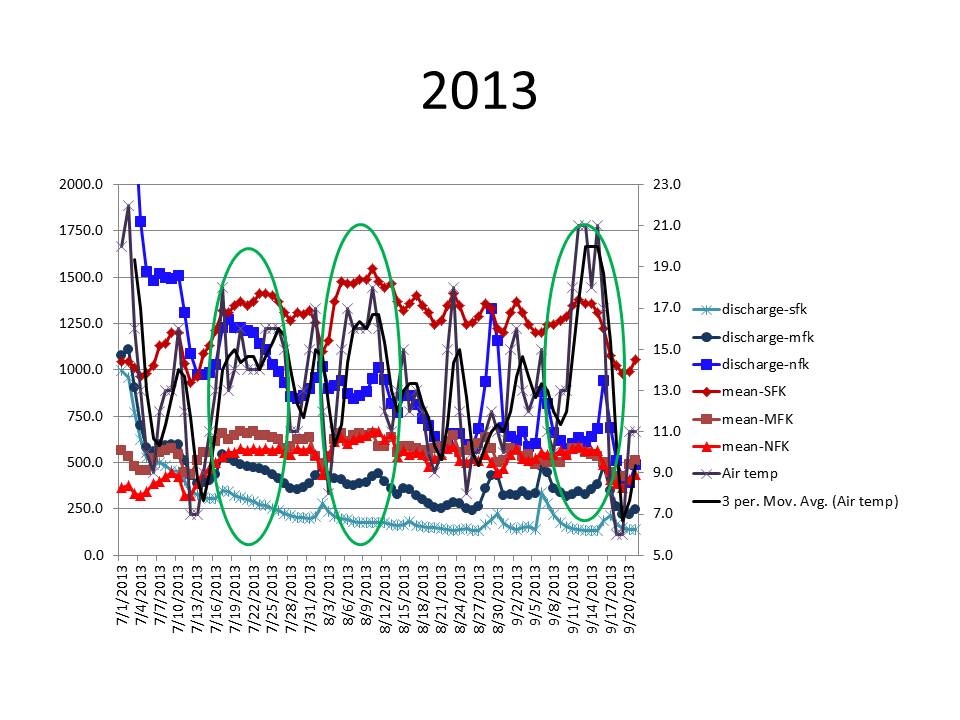
Streamflow and water temperature in the Nooksack in Summer 2013
 Dean of Academic Affairs at Nichols College and Professor of Environmental Science at Nichols College in Massachusetts since 1989. Glaciologist directing the North Cascade Glacier Climate Project since 1984. This project monitors the mass balance and behavior of more glaciers than any other in North America.