August 25, 2013
Storstrømmen Susceptible to Rapid Retreat
Posted by Mauri Pelto
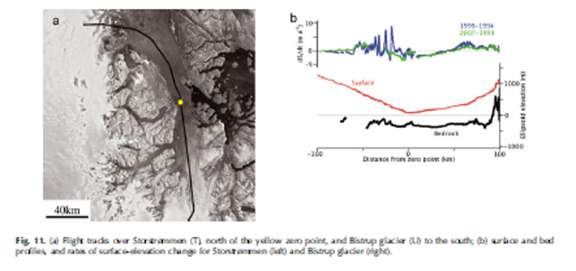
Storstrømmen and L. Bistrup Brae are large outlet glaciers in northeast Greenland that join at their terminus. This joined terminus area is referred to as Bredabrae, though here I refer to the glaciers individually. The calving front is long and has numerous island pinning points. There is a large relatively flat low lying terminus region. The glacier differs from the Zacharaie Isstrom and 79 Glacier in that it currently has quite a low velocity. Storstrømmen surged between 1978 and 1984 (Reeh et al, 1994). The glacier advanced and both terminus regions thickened. Thomas et al. (2009) provide a figure based on a flight over this 60 km long 15-25 km wide low lying, low slope, slow flowing ice plain. The bed of the glacier is 300-400 m below sea level. Joughin et al. (2010) observed the stagnation of the lower portion of this glacier. They further note that the lower 40 km of the Storstrømmen is still slowing and thinning, while further from the ice front the glacier is thickening. Joughin et al. (2010) identify the same drop in speed to near zero near the stagnant front of L. Bistrup Bræ. This thinning and slow down near the terminus and thickening upglacier is typical of a surge glacier.

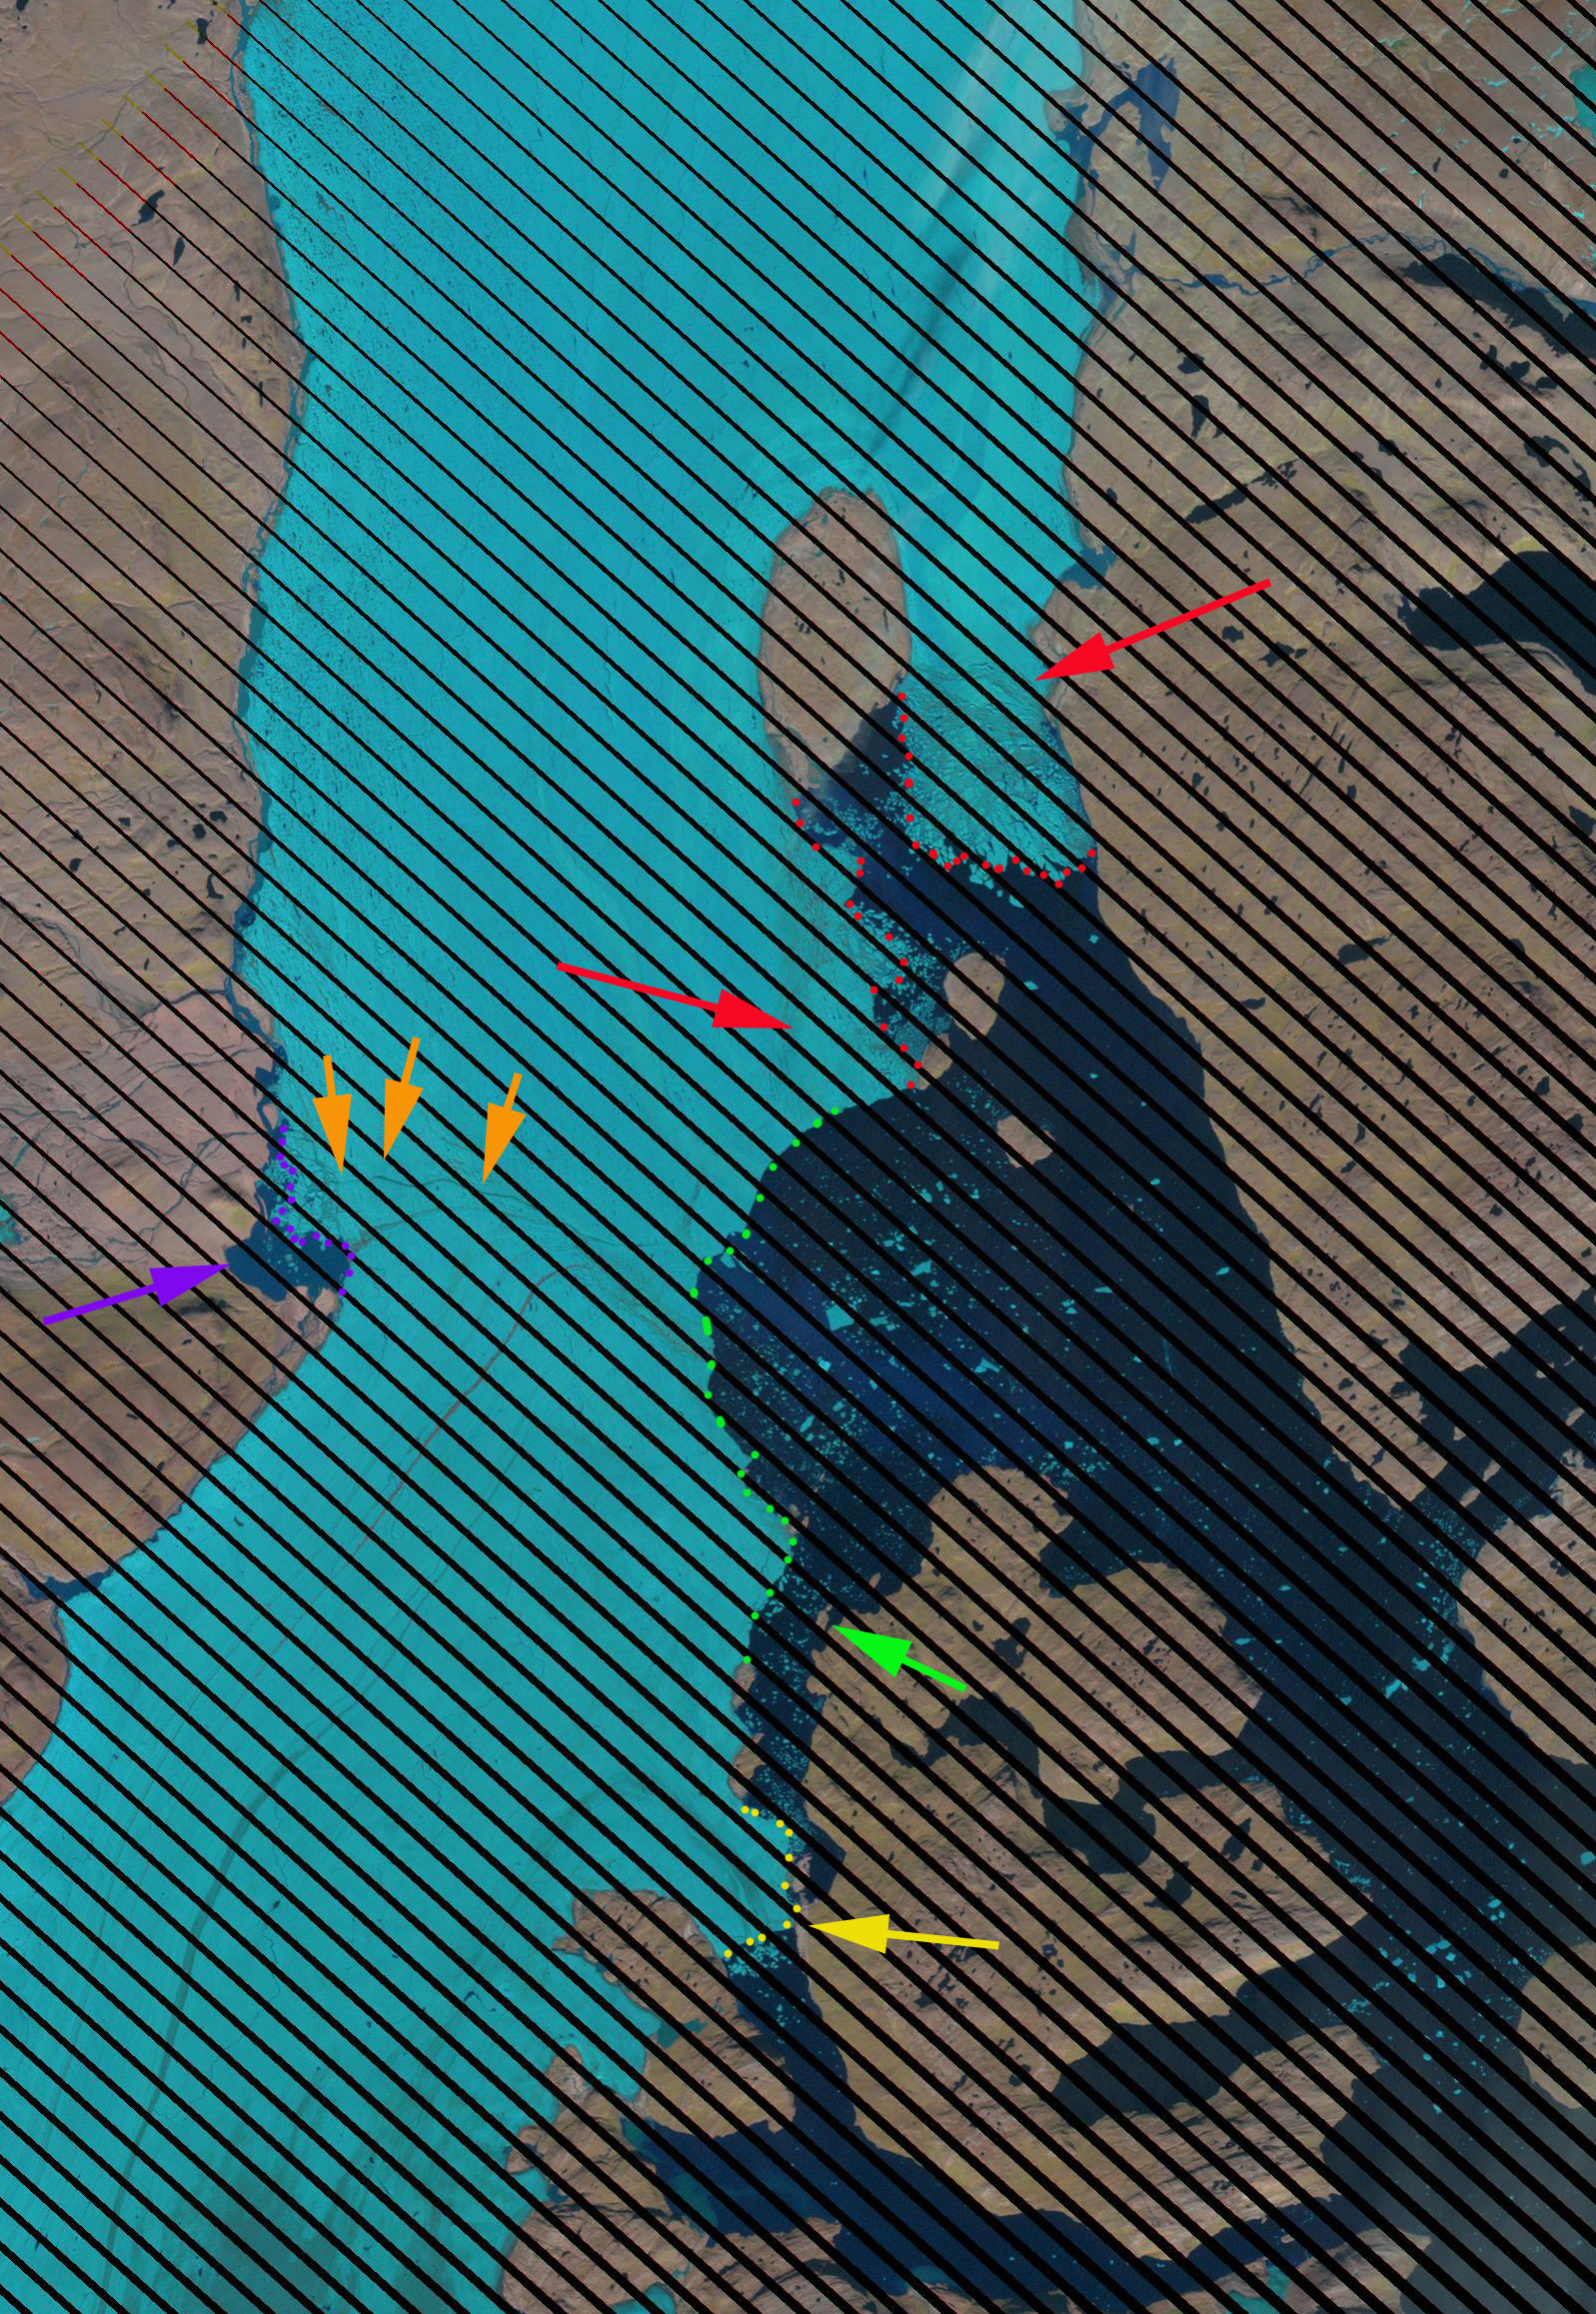
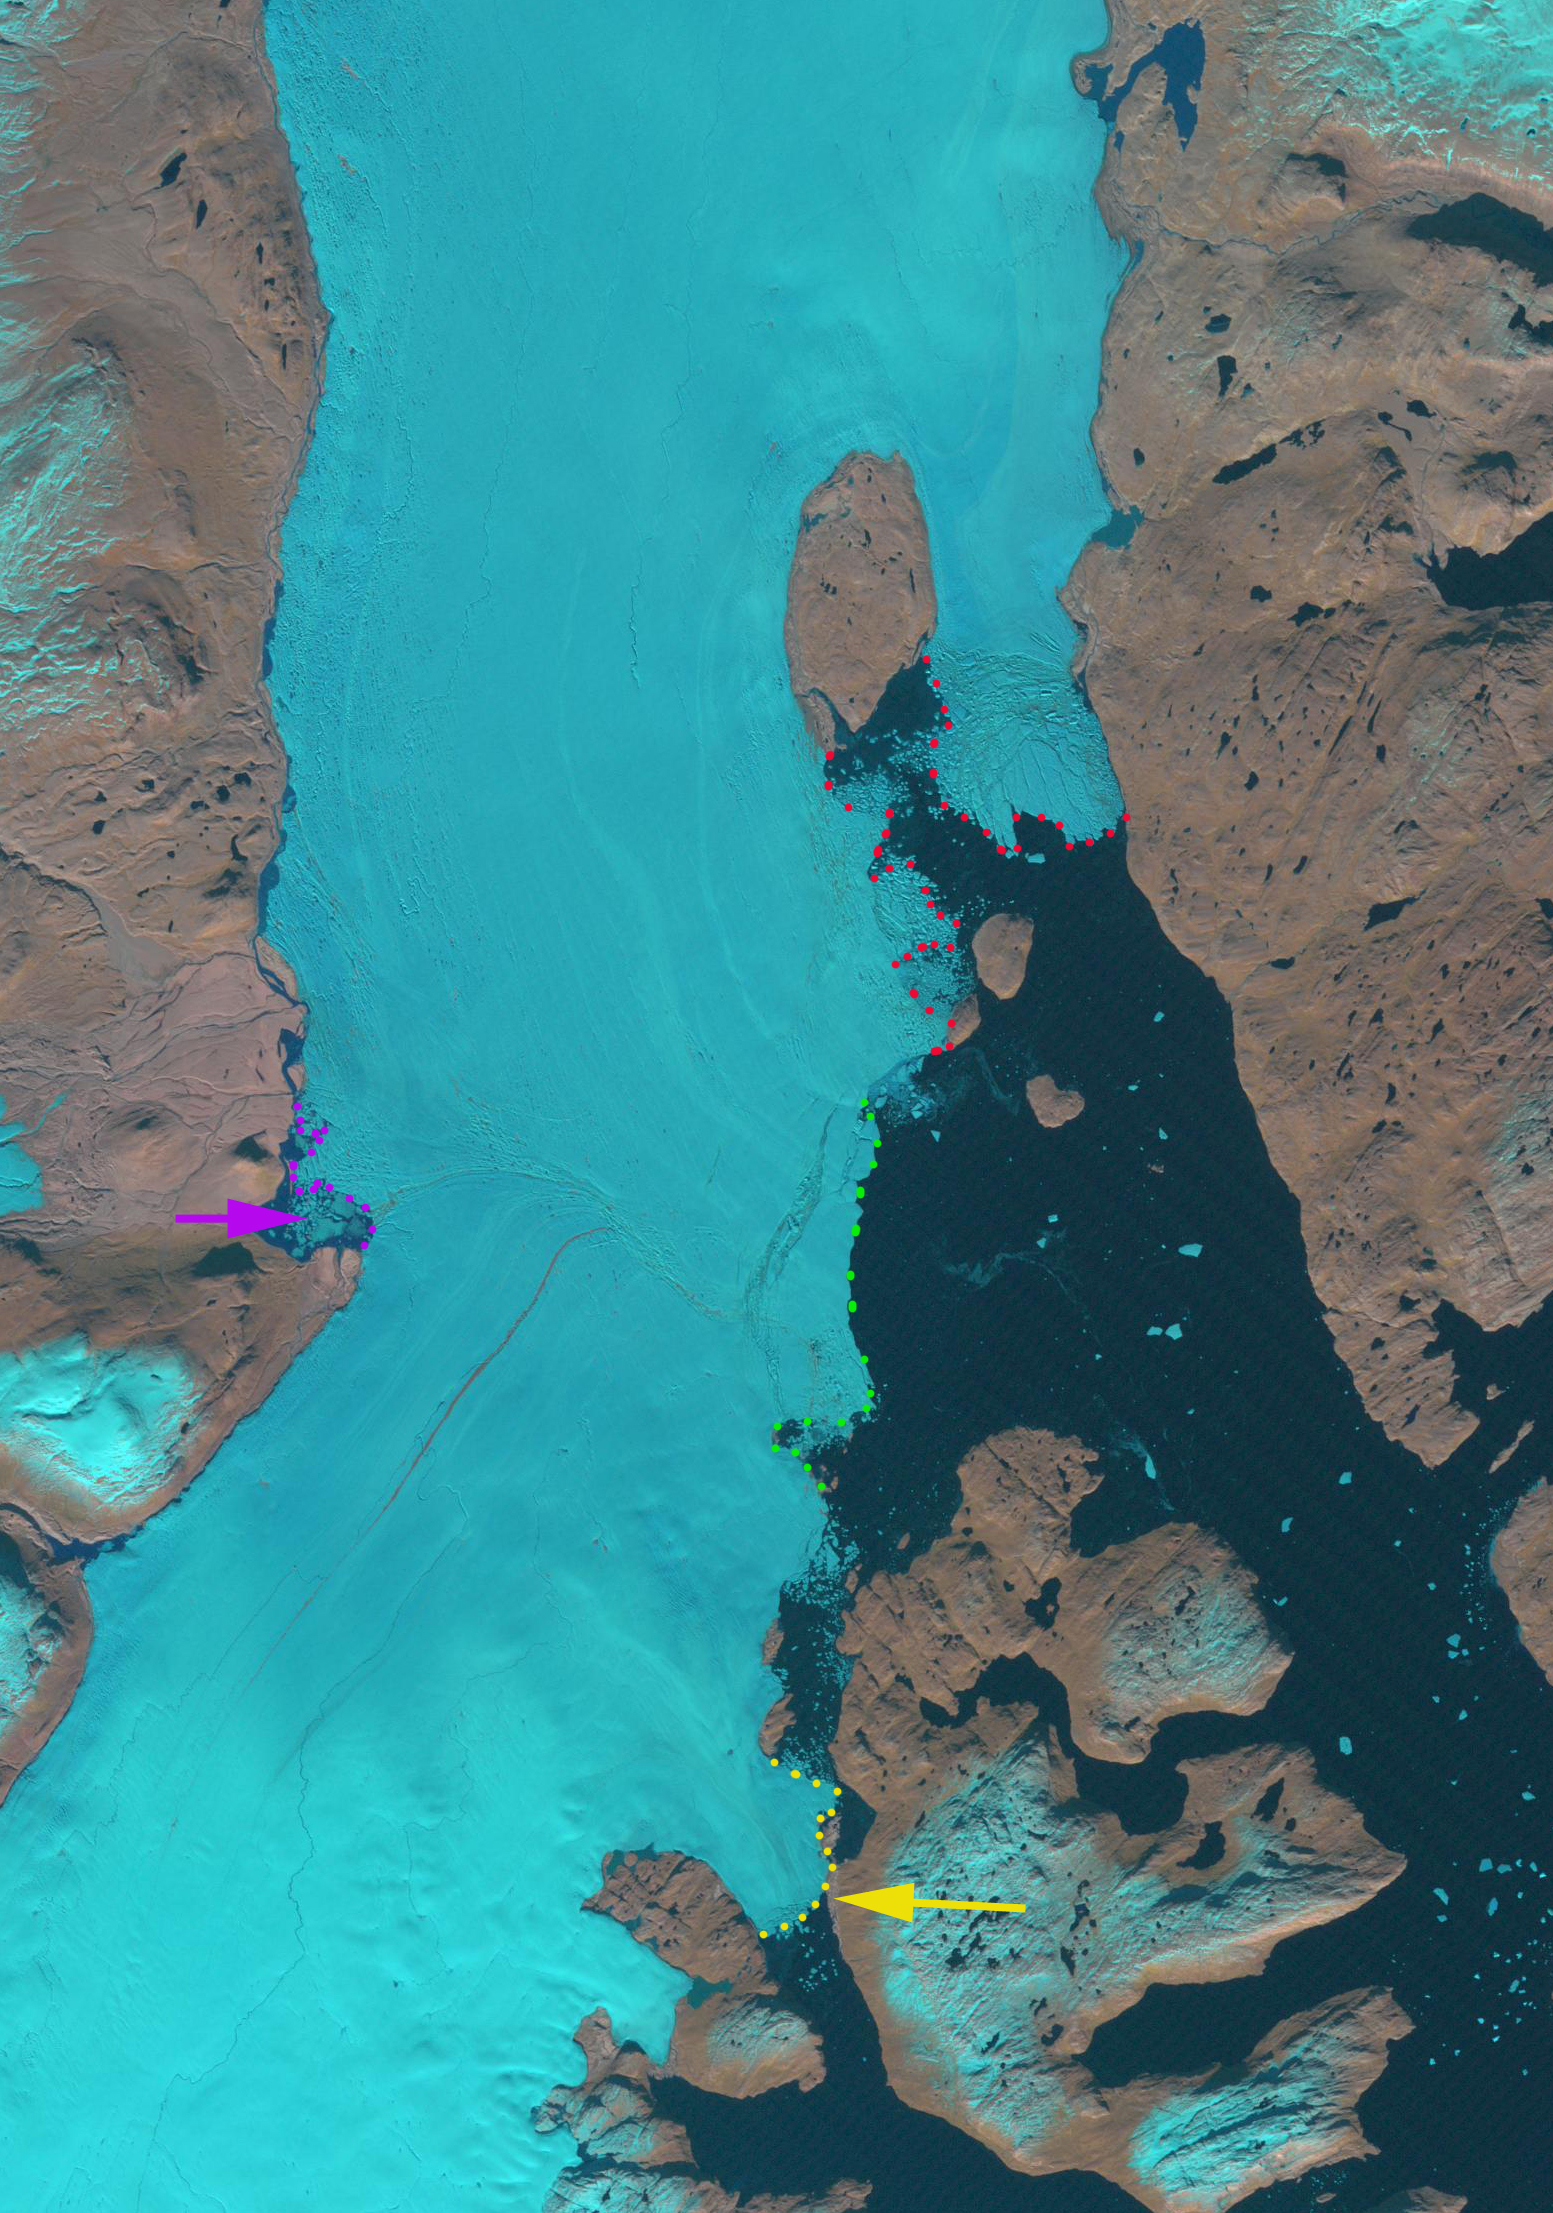
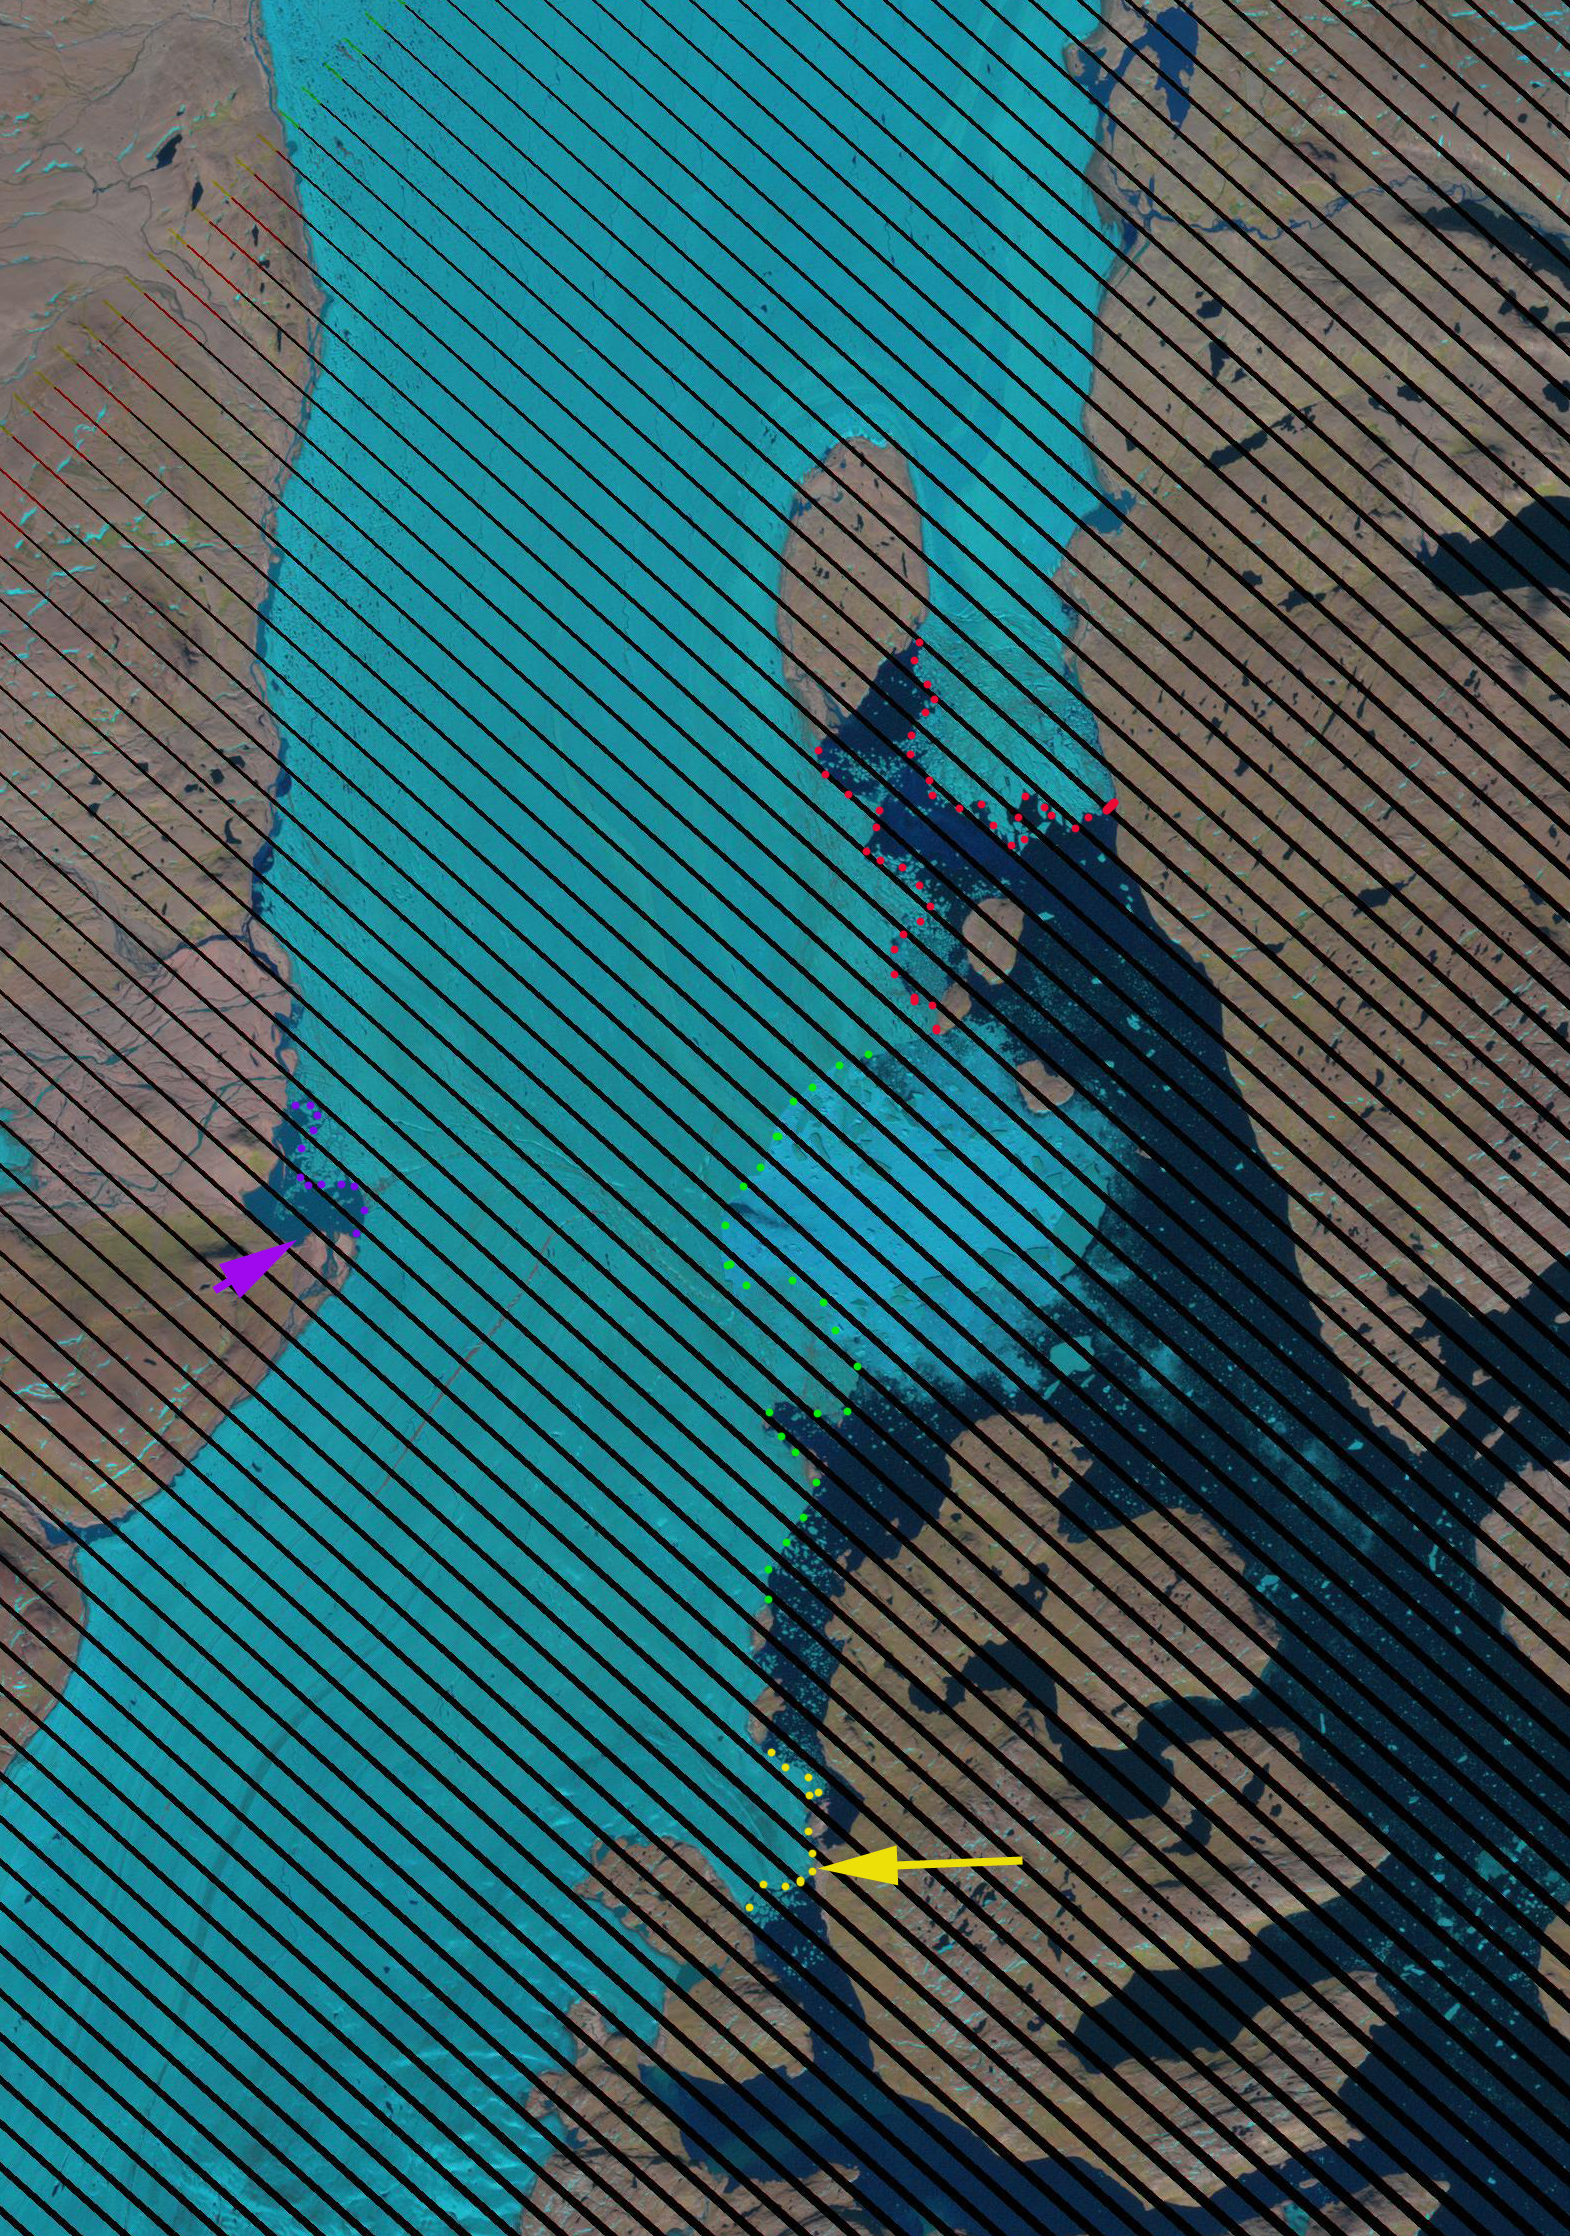
The question posed here is how vulnerable is this ice plain, given the recent years of high melting? Espen Olsen has been examining some potential cracks that could be indicators of weakening ice. Here we examine Landsat images from 2002, 2006, 2009, 2012 and 2013 to identify changes. In addition recent Google Earth images are used. In each image the yellow dots and arrow indicate the terminus of L. Bistrup Brae and its main pinning point. The red dots indicate the terminus of Storstrømmen. The green dots the main calving front that extends across both glaciers. The purple arrows and dots indicate a proglacial lake, Randsøen, on the inland side (western) of the ice plain near where the two glacier meet.
The first image below is from the Polar Portal indicating the terminus of the glacier in the mid-1980’s green and 2000 red on a 2013 Landsat image. The advance from the surge, post 1980’s image, is evident particularly in the main calving front between pinning point islands. The next two images are from 2002 and 2013. Terminus change is limited in the red dot region of Storstrommen. The red arrow indicates a rift on the eastern arm of Storstrommen that has remained in the same place for the last decade. The melange of ice in front of the rift has lost some area, but is largely intact, the stability indicates the lack of glacier velocity, but also suggests a limited water flux in the fjord here and limited melting. The L. Bistrup Brae margin, yellow dots, has retreated from one of the two key pinning points, yellow arrows. The main retreat is in the green dot section where the main advance had occurred, here the front has gone from convex in 2002, to concave in 2013 with 4 km of retreat. At the southern edge of the green dot section the glacier has pulled back from a island pinning point leaving an open water passage 1.6 km wide, green arrow. Another change is the expansion of the lake Randsøen at the western margin of the glacier downstream of the outlet streams from Borgjokulen, purple dots and arrow.
A closer look at various locations from Google Earth provides more detail, the image indicates it is from 4/10/2013 which is incorrect, however, it is quite recent. The first is the calving margin of Storstrommen, the two red arrows indicate substantial persistent rifts, with ice melanges beyond the rifts. Both the rifts and melanges have been pretty stable over the last decade. The area of coastline exposed in the midst of the margin along the south coast of the island has expanded slightly.
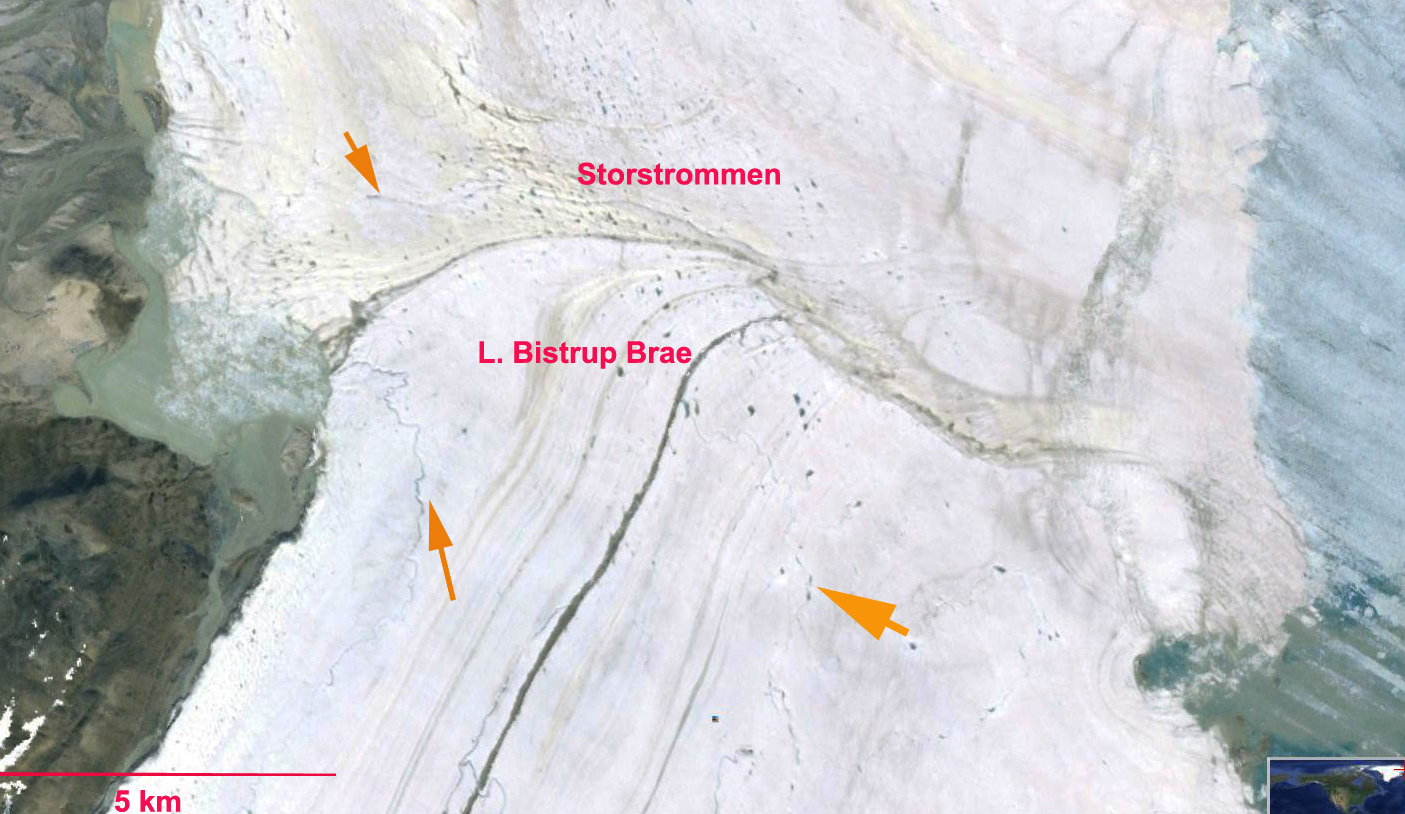
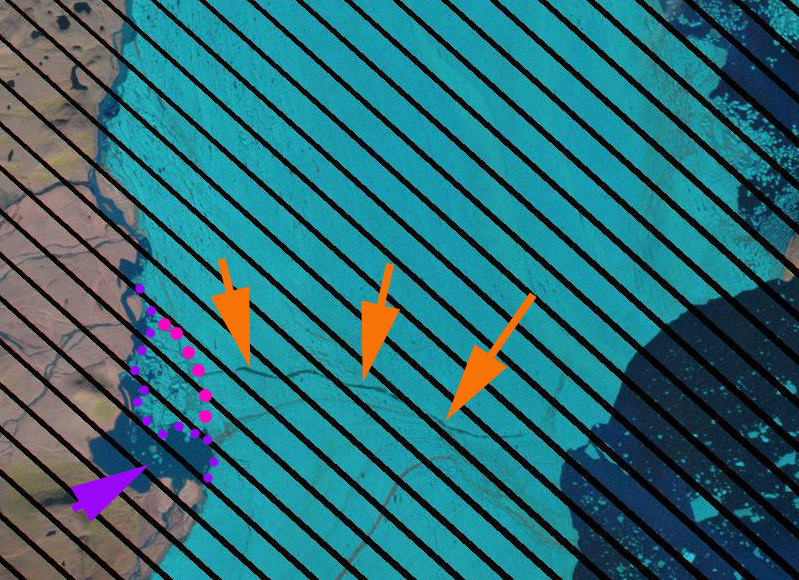
A closer look at the junction of the glaciers, the Bredbrae area, indicates a few substantial supraglacial streams, orange arrows. The front is also exhibiting a bit of a melange, that has been lost in recent Landsat imagery. The last closeup is of the L. Bistrup Brae terminus. The yellow arrow indicates the trimline of the recent advance that the glacier has retreated from. The N denotes a new island emerging from beneath the ice, indicating good pinning points, shallow water and limited calving in this area. The last image is a closeup of the proglacial Randsøen downstream of Borgjokulen. This lake indicates expansion, and considerable potential for more, note the heavily rifted, stream bisected area encompassed by purple and pink dots. A key change is the development of a substantial supraglacial stream that is first evident in the imagery in 2012, and expanded in 2013, orange arrows. This feature may well have existed prior to this but not at scale visible in Landsat. The stream has clearly expanded greatly in the last few years, likely due to enhanced melt. As we have seen on Petermann Glacier outlet streams are not key points of weakness for sections of floating or near floating ice, it is actual rifts. There are no rifts here. However, given the lack of velocity, and the presence of so much surface melt and some bottom melt at least near Randsøen, the large supraglacial stream indicates a section of the glacier that is thinning and quite vulnerable. In particular if the juncture area of Storstrommen and L.Bistrup Brae continues to thin and rift, this is the likely place for a collapse to occur. The thin nature of this section in the Polar Portal terminus of the 1980’s, less than 10 km, indicates this is the weakness. A key question of mine is how extensive is bottom melting for this glacier? The lack of a large floating tongue and low flux in and out of the fjord suggested by the melanges, suggests basal melt is lower than for many glaciers. Andreas Muenchow’s, a physical oceanographer at U. Delaware, notes that Reeh et al (2004) does not indicate significant bottom melting for Storstrømmen and that the a close look at the Lidar and Radar data from Operation IceBridge is essential to address this issue.
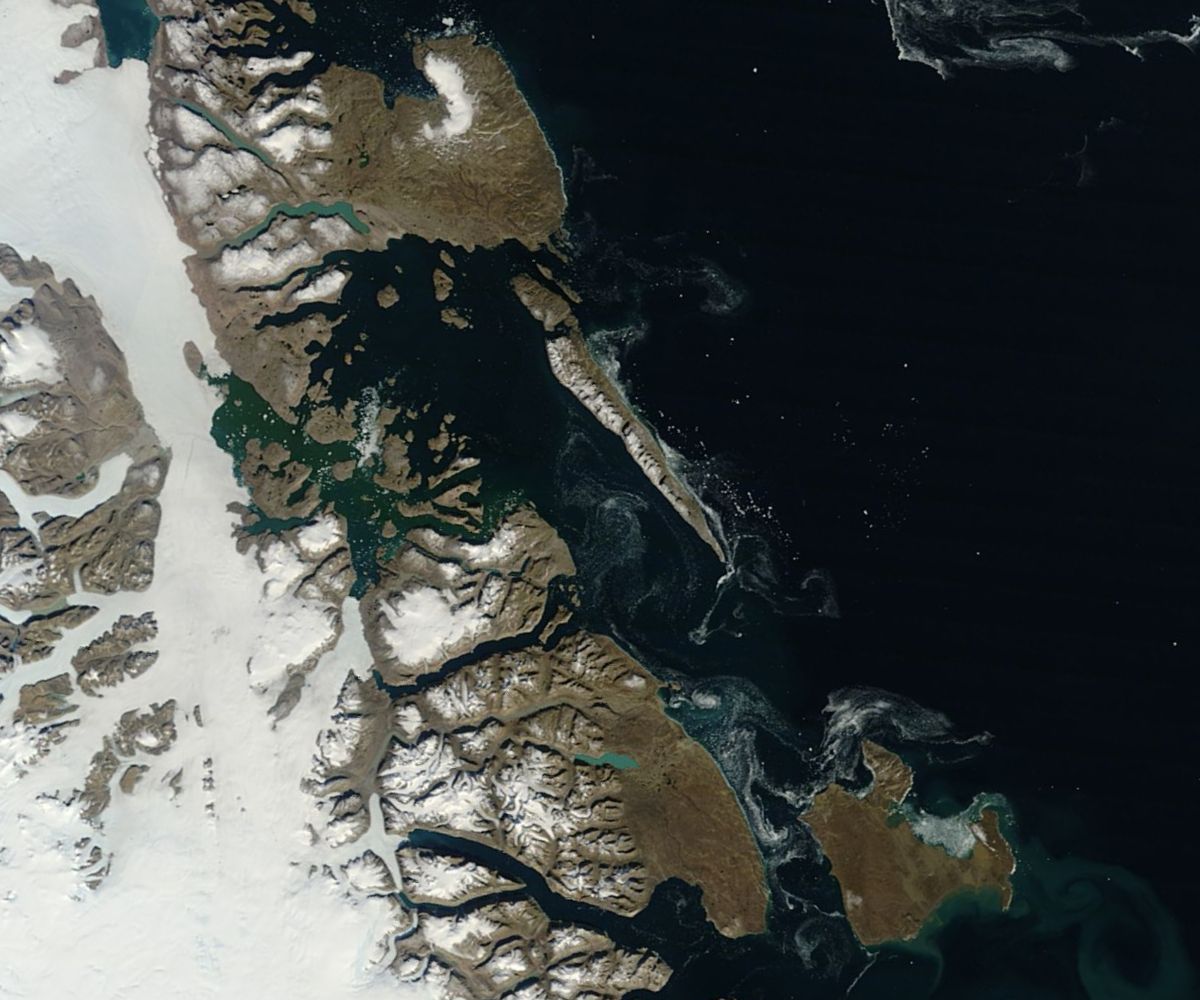
The last few images are Landsat images from 2006, 2009 and 2012 reinforcing the above that the main terminus change is in the central green dot section, that there are considerable pinning points for both L. Bistrup Brae and Storstrommen on their eastern margins, suggesting the central margin is the weak point. The central margin is also where the large proglacial lake has developed on the west margin of the glacier. The last image is MODIS from 8/23/2013. This indicates little change from the July 2013 Landsat images. However, what is illustrated is the fantastic range of imagery thanks to NASA, with high resolution of Landsat and high frequency of MODIS, and both readily available.




 Dean of Academic Affairs at Nichols College and Professor of Environmental Science at Nichols College in Massachusetts since 1989. Glaciologist directing the North Cascade Glacier Climate Project since 1984. This project monitors the mass balance and behavior of more glaciers than any other in North America.
[…] glacial ice resting on the bedrock begins to float—since the mid 1990s. And the overall recent retreat of the glacier fronts is likely related to thinning of the glaciers via long-term processes such […]
[…] glacial ice resting on the bedrock begins to float—since the mid-1990s. And the overall recent retreat of the glacier fronts is likely related to thinning of the glaciers via long-term processes such as […]
[…] glacial ice resting on the bedrock begins to float—since the mid-1990s. And the overall recent retreat of the glacier fronts is likely related to thinning of the glaciers via long-term processes such as […]
[…] glacial ice resting on the bedrock begins to float—since the mid 1990s. And the overall recent retreat of the glacier fronts is likely related to thinning of the glaciers via long-term processes such as […]