July 31, 2012
Glacier Ground Truth-2012 Field Season
Posted by Mauri Pelto
For the 29th summer in a row we will be measuring glacier mass balance in the field, in the North Cascades, Washington, over the next three weeks, no new posts during this period. Glacier mass balance is the most sensitive measure of glacier response to climate. In the past the only way to determine mass balance was detailed field measurements. Today there is sufficient satellite imagery to provide data that can be used in conjunction with ground truth to determine the mass balance of a glacier using a model. The ground truth we complete provides richer spatial detail than remote sensing can today.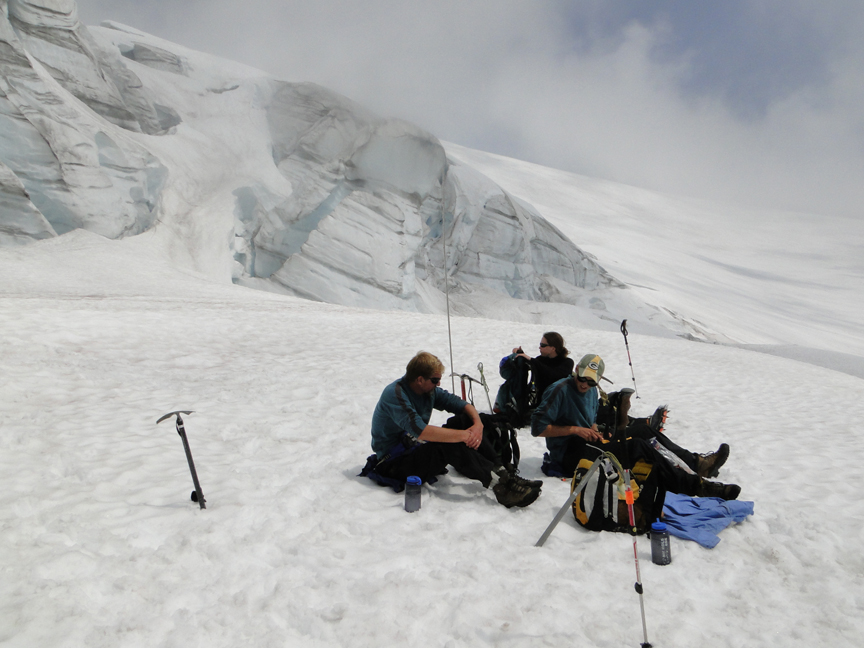 Satellite imagery provides excellent big picture and time specific data, but still needs ground truth. For example the National Operational Hydrologic Remote Sensing Center (NOHRSC) now provides daily snowpack and snowmelt maps that are based on satellite imagery and climate models. A snapshot is provided of two of these from early July 2012 in the area of Mount Baker, WA, where we will be working shortly note blue arrows indicating specific glaciers. The first image is the snowpack in snow water equivalent (SWE). It is assessed at over 30 inches remaining. The second is of the snowmelt in SWE for the same area over a 72 hour period ranging from 1.5 to 4 inches.
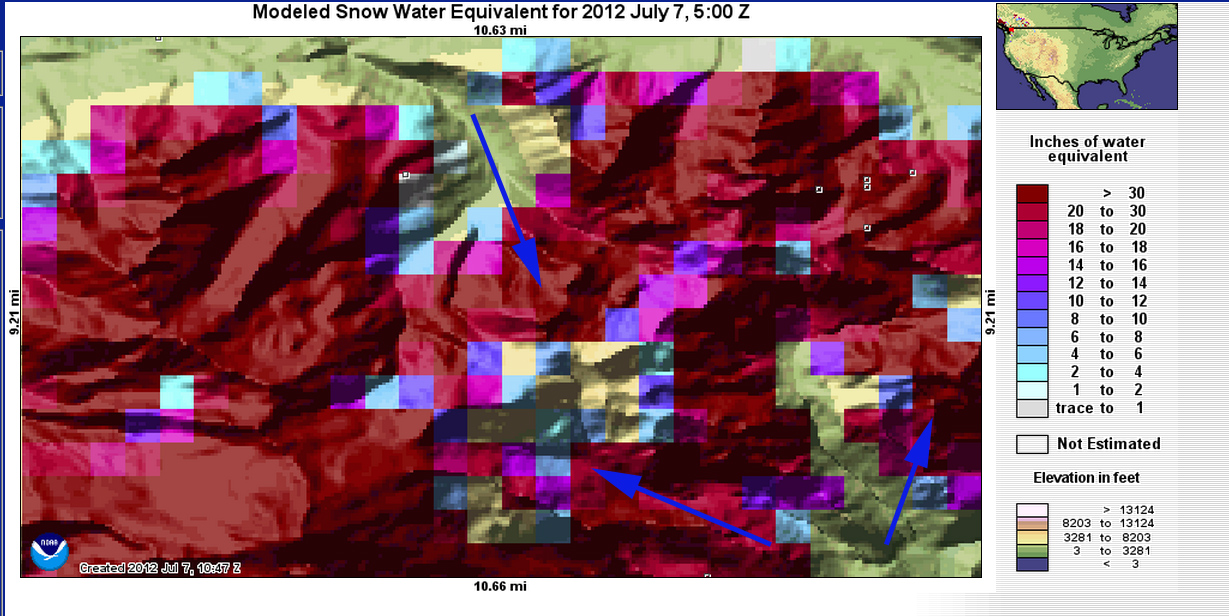
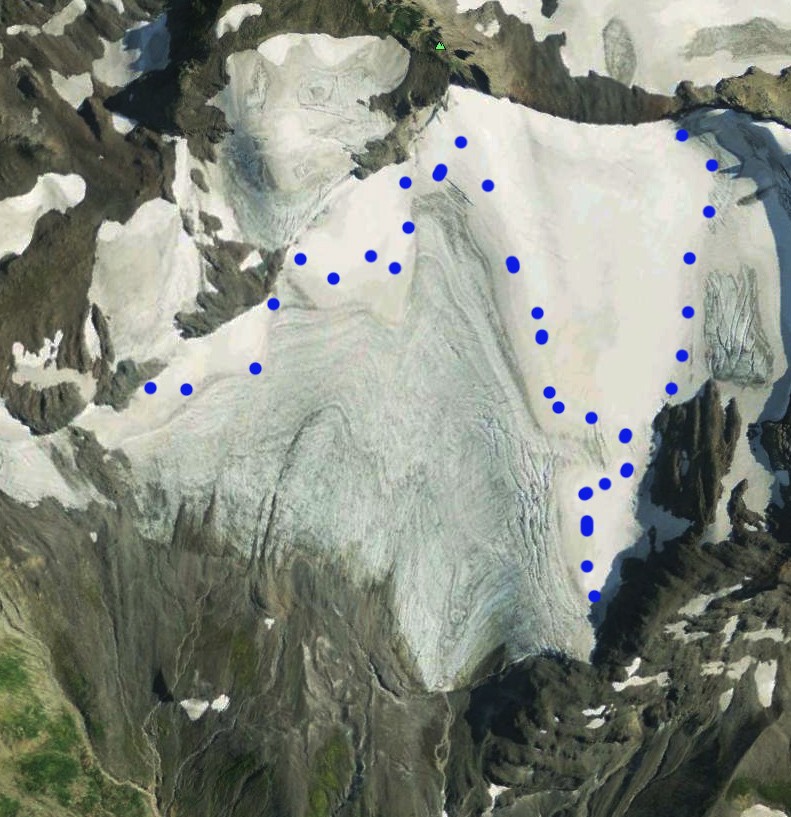
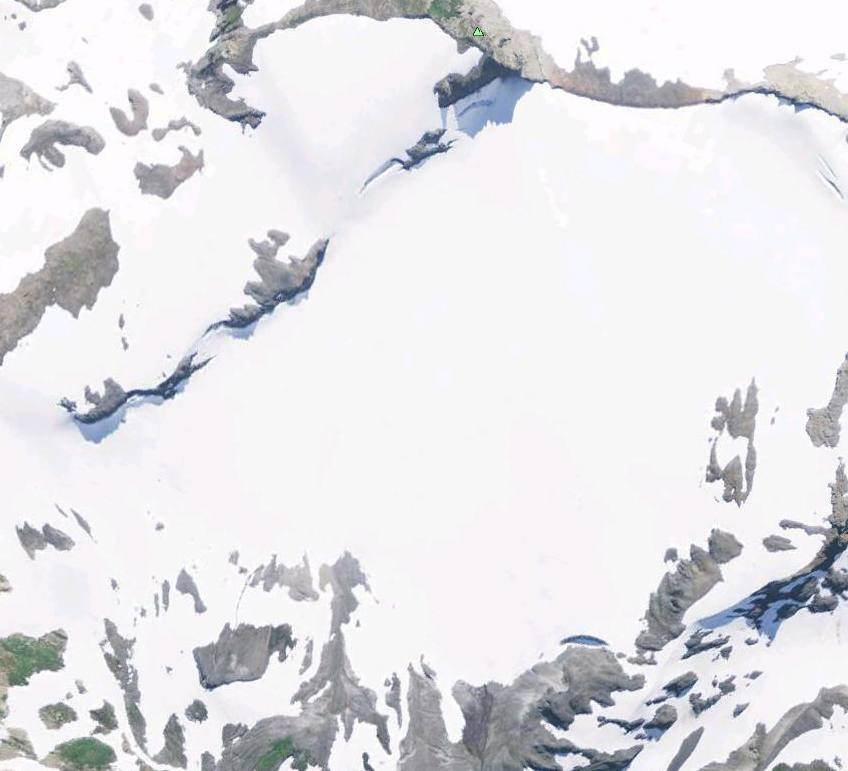
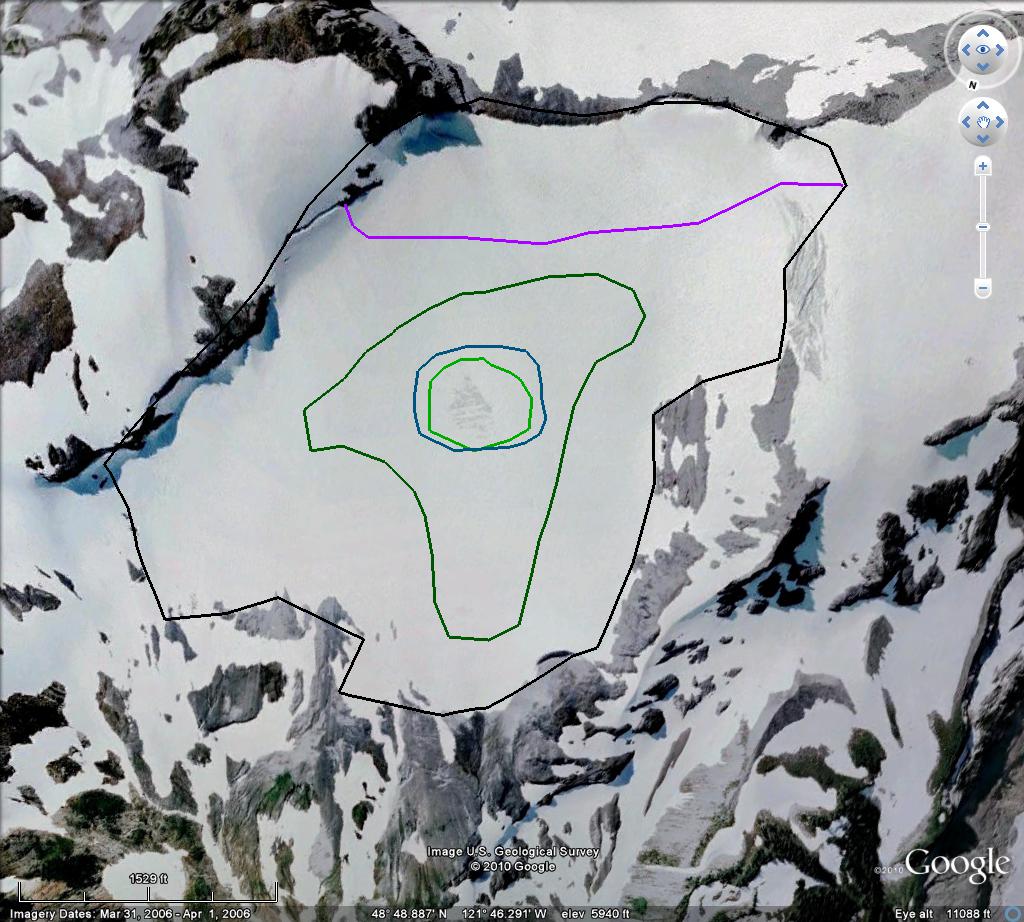
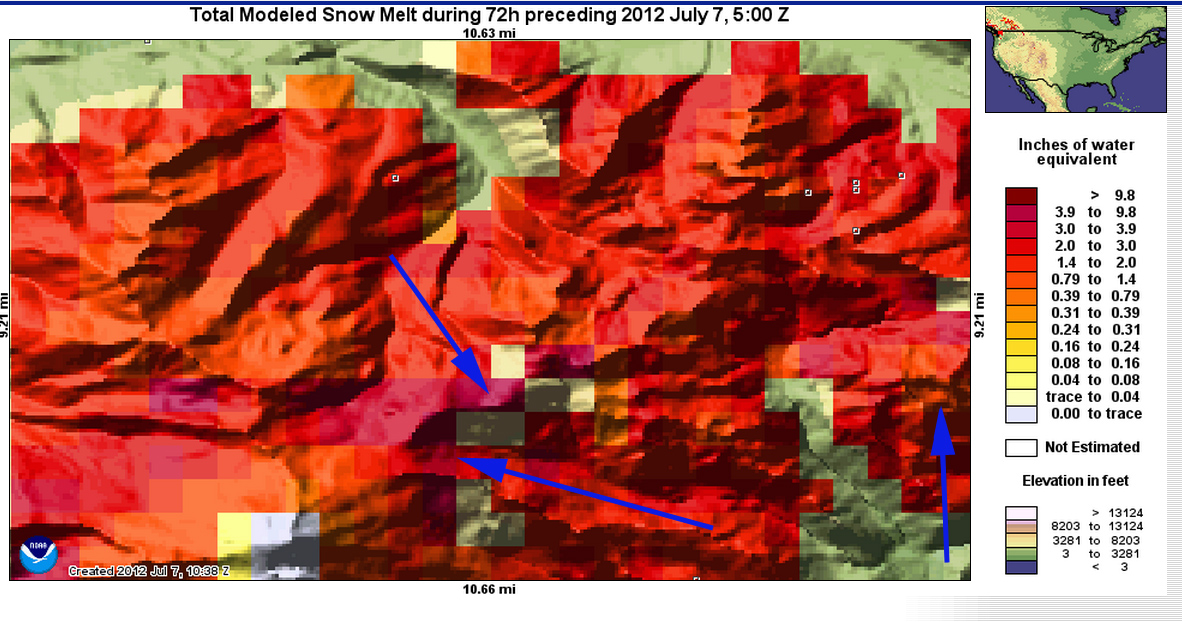 NOHRSC products are not really designed for glaciated elevations or mid-summer conditions, the system has been well verified for most areas of our nation for most times of the normal snowcover season. The Sholes Glacier in summer fits neither. We will be measuring the snowpack at over 500 locations around the blue arrows. We will also be continuing to measure the snowmelt on the same glaciers as the summer progresses. Other satellite images provide a detailed look at a glacier, but are acquired only on occassion. This is indicated by the excellent images in Google Earth from Sept. 2009 and Sept. 2011 of Sholes Glacier which show a much different story in terms of snowpack extent. The blue dots indicate the 2009 snowline, where snow from the winter survived the summer melt season up to that date. In 2009 the glacier was 30% snowcovered at the end of the melt season, in 2011 the glacier was 95% snowcovered. We will be taking over 100 measurements of snow depth on this glacier to provide the detail that allows the pattern of snowcover alone to be used to identify the snowpack distribution and hence mass balance of the glacier.


 Dean of Academic Affairs at Nichols College and Professor of Environmental Science at Nichols College in Massachusetts since 1989. Glaciologist directing the North Cascade Glacier Climate Project since 1984. This project monitors the mass balance and behavior of more glaciers than any other in North America.