July 14, 2012
Easton Glacier Assessment, Washington
Posted by Mauri Pelto
In August we will be making a detailed study of the Easton Glacier for the 23rd consecutive summer. Our main focus is measurement of snow depth and snow melt on the glacier. We will be mapping the terminus position and two profiles of the surface elevation across the glaciers at 1800 m and 1950 m. We will also examine two new bedrock knobs that have melted out in the midst of the glacier at 2050 m. The Easton Glacier is important as a water resource for the Baker lake and Baker River Hydropower system. This hydropower system is capable of producing 170 MW of power. The runoff from Easton Glacier would normally flow into the Baker River below Upper Baker Dam, however it is extracted from the normal stream and routed through a pipeline to enter Baker Lake and then produce power via Upper Baker Dam (second image), note yellow dots showing runoff pathway.
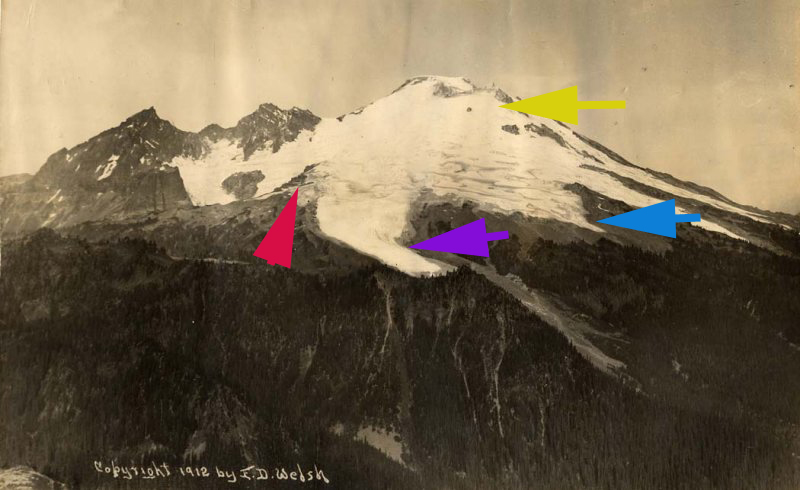
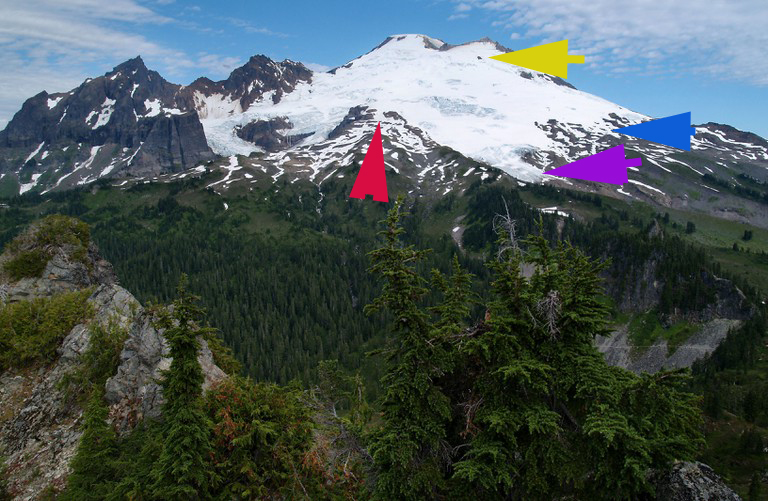
 The Easton Glacier retreated over 2 km from its Little Ice Age maximum to 1955. By 1965 the glacier was advancing, this advance ended in the early 1980’s and by 1987 retreat from the moraine was evident. Beginning in 1990 we have made an annual survey of the glacier terminus noting a retreat of 320 m from 1987-2010. The first image below is of Easton Glacier from 1912 the second from 2011 with the same locations highlighted. A prominent knob on the upper glacier has changed little, ocher arrow. The lower margin of the glacier on either side of the main Easton at the blue arrow and red arrow show substantial thinning and retreat. The purple arrow indicates the terminus change. The lower Easton Glacier has changed a great deal in the last 100 years, not the upper glacier. This is an indication of a glacier adjusting to climate change that is retaining an accumulation and can survive. The last image in the sequence indicates the Little Ice Age terminus yellow line, the 1993 terminus orange, 1998 terminus is purple, 2004 terminus is green and 2009 terminus is ochre.

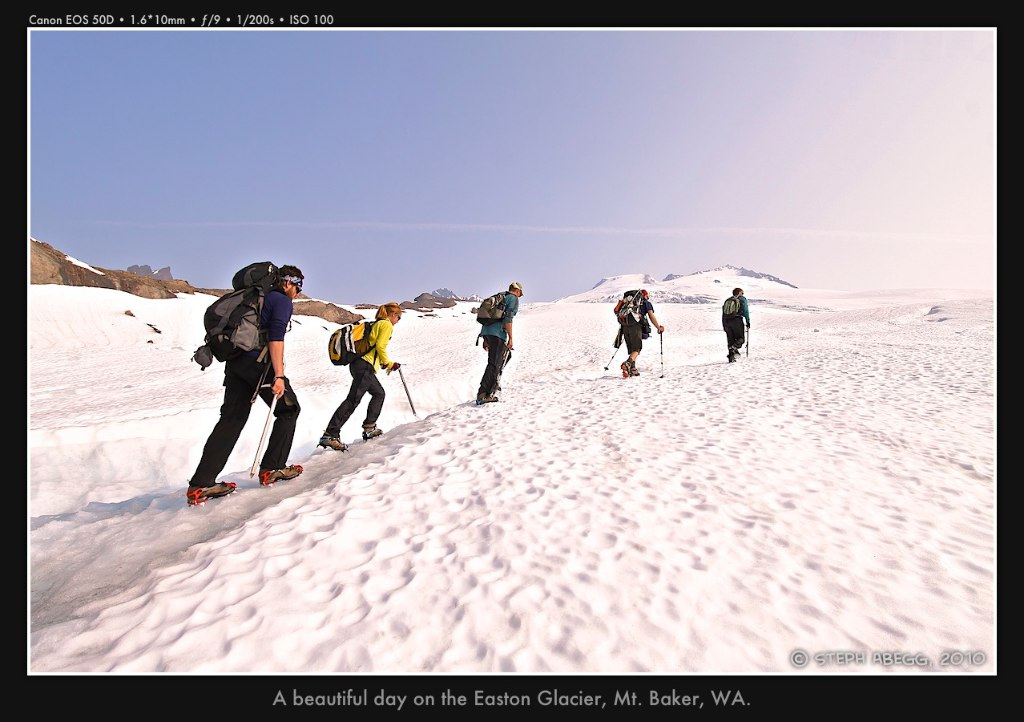
 In the above image the red arrows indicate the location of the two survey profiles we complete across the glacier. The green arrows indicate two locations of investigation for the summer, to the left is the top of the Deming Glacier Icefall that will visit and the right green arrow a new bedrock knob that emerged from beneath the glacier in 2009. A month from now we will be surveying the glacier covering the glacier top to bottom and side to side. We will be joned by Peter Sinclair who is going to use is videography skills to examine how we measure glacier change. The first image below is from Steph Abegg a superb climber and photographer who was with us in 2010 as part of Team Juicebox working on the Uncertain Ice documentary.
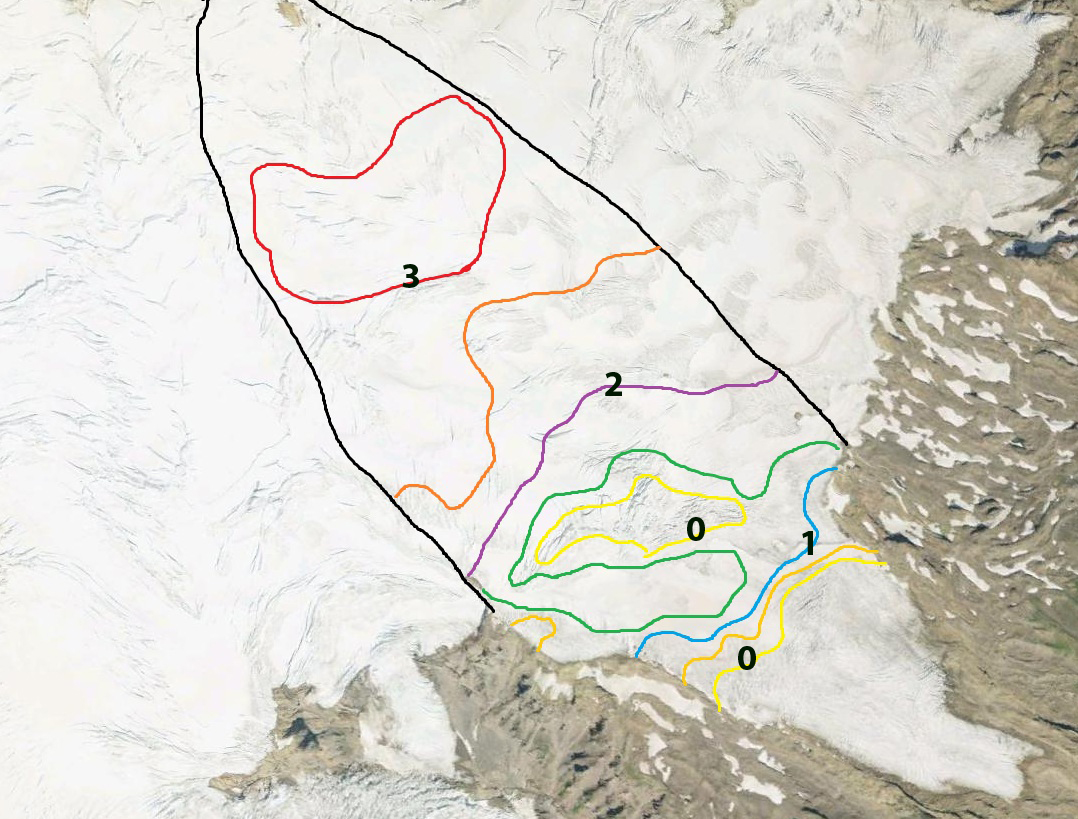
 The main goal of our research each year is assessing the glacier’s mass balance. This is the equivalent of its bank account, with snow accumulation being deposits and snow-ice melt being withdraws. We map the changes across the glacier and determine if the bank account grew or declined, 2011 map is below. Since 1990 the bank account has lost 10 meters of thickness of an average of 70 m total. Last year the glacier did gain over a meter. A key measure is the percent of the glacier in the accumulation zone (AAR), below 65% is a loss above a gain, bottom image. The 2012 winter was a La Nina which tends to lead to very good snowpack, the transition out of La Nina took place in late spring-early summer leading to greater melting than 2011, we will see in three weeks.


 Dean of Academic Affairs at Nichols College and Professor of Environmental Science at Nichols College in Massachusetts since 1989. Glaciologist directing the North Cascade Glacier Climate Project since 1984. This project monitors the mass balance and behavior of more glaciers than any other in North America.