October 24, 2009
Mass Balance of the Easton Glacier 2009
Posted by Mauri Pelto
Immediately below is Easton Glacier on Mt. Baker in the North Cascades in late May 2009. The glacier is still completely snow covered. The bench where the small gray cloud shadows are at 6000 feet averages 20 feet of snow remaining.
 Easton Glacier extends from the terminus at 5600 feet to the slopes near Sherman Crater at 9000 feet. Each summer since 1990 NCGCP has measured the mass balance of this glacier. View Youtube for a pictorial review of the full 2009 field season . The glacier has retreated 300 m since 1990. During this same period the glacier has lost a cumulative mean of 13 m of thickness. Given a thickness in 1990 between 60 and 75 m, this is about 20 % of the total glacier volume. The image below shows the terminus in 2009(green=2009, 2006=brown, red=2003, purple=1993 and yellow=1984).
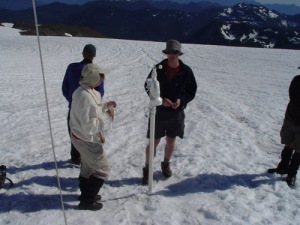
  Measuring mass balance requires assessing snowpack depth and areal extent at the end of the summer melt season and the amount of melting in areas where blue ice or firn (snow more than a year old) is exposed. Below is measuring crevasse stratigraphy and below that emplacing a stake to measure ablation with weather instruments on it.

Mass Balance = residual snow accumulation – ice-firn melting.
The melt season began a bit late just when the May picture was taken Winter snowpack was between 75and 90% of normal in the area as of April 1. The melt season had been late to begin and snowpack by late May was near normal. Record heat was experienced at the end of May and the start of June, quickly causing snowpack to fall below normal.Each year we measure the snow depth via probing and crevasse stratigraphy at more than 200 locations. These depth measurements allow the completion of a map of snow distribution. This map is completed in early August and updated, based on a smaller number of observation in late September. The amount of melting is assessed from stakes emplaced in the glacier and the recession of the snowline in areas where snow pack depth has been assessed. below are images from early and then mid-August indicating the rise of the snowline. 

A warm June and July caused exceptional snow pack melt and by early August when we began assessing snow pack depth retained, the snowcover had receded to the 6400 foot level, 300-400 feet higher than normal. Snowpack remained below normal all the way to the 8600 foot level. the snowpack since early July had been rising nearly 100 feet per week. By mid-August at right the snow line on the glacier averaged 6800 feet. By mid and Late September the snowline had risen to 7400 feet a rate of rise of 150 feet per week since mid-August. Below is an image from mid-September 2009.  The amount of melting on the glacier in July was the highest we have measured totaling, 2.1 m. This led to the exposure of a couple of new bedrock knobs evident in the picture at right near the 2100 meters, black arrows. Overall the mass balance of the glacier in 2009 was a negative 2.06 m. This glacier averages 55-70 m in thickness and this mass balance loss represents a 3% volume loss in a single year for the glacier.


 Dean of Academic Affairs at Nichols College and Professor of Environmental Science at Nichols College in Massachusetts since 1989. Glaciologist directing the North Cascade Glacier Climate Project since 1984. This project monitors the mass balance and behavior of more glaciers than any other in North America.