
June 28, 2009
Recession of Jakobshavn Isbrae continues
Posted by Mauri Pelto
The Jakobshavn Isbrae (glacier) has captured our attention over the last 30 years because it has the highest long term average velocity of any glacier in the world. At the ice front the velocity has remained above 16 meters per day for all measurements completed over the last 50 years. The ability of this glacier which is 10 km wide at its front and 800 m thick at the calving front to drain 6.5 % of the Greenland Ice Sheet is its importance. The annual volume of discharge is 40 cubic kilometers. This prompted the University of Maine’s Terry Hughes to take a close look at the glacier in 1985. I participated in that project and one key conclusion we reached was that the Jakobshavn Isbrae was in approximate equilibrium (Pelto and others, 1989). The terminus had not shifted significantly in the past 30 years and no thinning was evident either. The image below of terminus change The top image above is from Jason Box, Byrd Polar Research Center, Ohio State University, and is a mosaic of Landsat and ASTER images indicates a substantial retreat from 1850-1964 of about 30 km. The first image is from the fall of 2009 and the second a Modis image from June 2010. The third from July 2010,from NASA. The last two in the sequence are Landat 8 imagery from May 9 and June 1, 2014 indicate an early summer retreat that was first noticed by the ongoing sharp observations of Espen Olsen. The retreat follows the typical winter advance, and is not back to the 2013 furthest retreat also identified by Espen Olsen. Notes on these latest images below the sequence.
From 1964 to 2001 the glacier terminus did not recede significantly and observations of terminus velocity remained relatively constant at 16 to 20 m year at the glacier front. Then in 1997 an acceleration began. The velocity reached 34 m per day by 2003, twice its normal speed, the glacier thinned by up to 15 m year and retreated 10 km, from 2001 to 2003. From 2004-2007 an additional retreat of 5 km occurred.


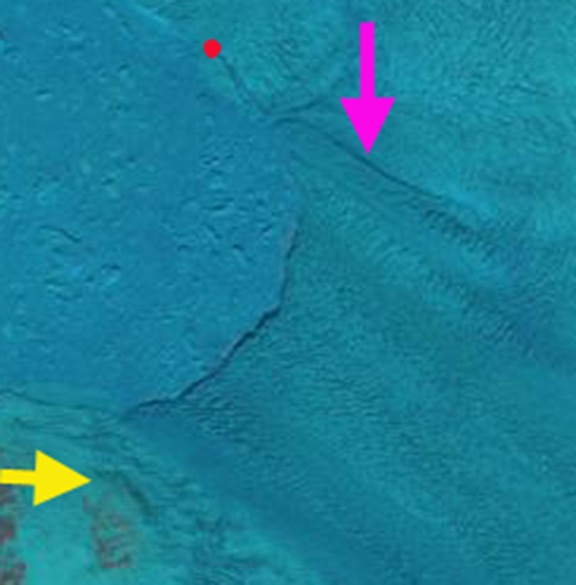
[caption id="attachment_7425" align="aligncenter" width="480"] Pink arrow indicates a prominent lateral rift. Yellow arrow reference location. Red dot an existing transverse rift.
The pink arrow notes a prominent lateral rift, the yellow arrow a reference point. Red dot is a transverse rift near the ice front. No large rifts are apparent in the area of the main calving on May 9.[/caption] A bedrock high beneath the glacier is reflected by the sudden increase in slope below point A. What is fascinating is the speed at which the glacier surface below A at Point C was transformed from an ordinary set of transverse crevasses to the chaotic scene typically indicative of an area of rapid acceleration and failure of seracs, those walls betweens crevasses. The glacier has had a profound response to the rifting-calving retreat of the previous day. The area of crevasse transformation is an indication of the connection of this area of the glacier to action at the terminus, the crevassed areas response was so swift that it was effectively involved in the calving retreat incident. The area around C is a zone of weakness to watch for further appearance of rifting. The area in front of the bedrock high is clearly not a place for the terminus to stabilize. The bedrock high itself could well be a point of greater stability for the terminus. Upglacier 2010 is not a good year for the glacier either the snowline is high for June exposing larger areas of bare glacier ice with higher albedo for melting, see image at bottom.
On Jakobshavn the acceleration began at the calving front and spread up-glacier 20 km in 1997 and up to 55 km inland by 2003 (Joughin et al., 2004). Luckman et. al., (2006) observed…“The most plausible sequence of events is that the thinning eventually reached a threshold, ungrounded the glacier tongues and subsequently allowed acceleration, retreat and further thinning. It is reasonable to believe that the 1998 Jakobshavn speed-up, also following a long period of stability, was triggered by the same processes of thinning but occurred earlier and after a shorter period of thinning because the tongue was already afloat.”
On Jakobshavn the acceleration was not restricted to the summer, persisting through the winter when surface meltwater is absent. This indicates that it is the change in conditions at the calving front where the backforce on the glacier was reduced that allowed acceleration and retreat. This is typical for Greenland marine terminating outlet glaciers, they have accelerated most at the calving front and the acceleration is not seasonal. The acceleration is not significantly due to meltwater enhanced lubrication. Below is the acceleration of the last decade compared to before, illustrating that the greatest acceleration is at the calving front (Thomas et al., 2009). 
The Jakobshavn is of particular importance as it has a bed below sea level for at least 80 km inland from the terminus. In this reach there are no significant pinning points, or abrupt changes in slope or width (Clarke and Echelmeyer, 1996) that would help stabilize the glacier during retreat. In particular the bed becomes deeper from 24-40 km behind the calving front, which should reinforce calving acceleration (Thomas et al., 2009).  Images of Jakobshavn Isbrae in 2001 indicate substantial rifts on the north side of the glacier near the 2005 terminus position, suggesting the glacier had been preconditioned for retreat. In the image below from June 17, 2010 the snowline is evident on the north side of Jakobshavn as the transition to the much lighter blue tone, in this Landsat image. The red line is the June 2009 snowline and the green line the 2008 June snowline.
A comparison of April 2010 (top image below) and April 2011 Landsat image (middle image) indicates a somewhat lower snowline on the Jakboshavn in 2011. The zoomed in version indicates the amount o the ice that is actually icebergs. 


 Dean of Academic Affairs at Nichols College and Professor of Environmental Science at Nichols College in Massachusetts since 1989. Glaciologist directing the North Cascade Glacier Climate Project since 1984. This project monitors the mass balance and behavior of more glaciers than any other in North America.