
16 May 2016
How Fast Is New Orleans Sinking? This Fast
Posted by Dan Satterfield
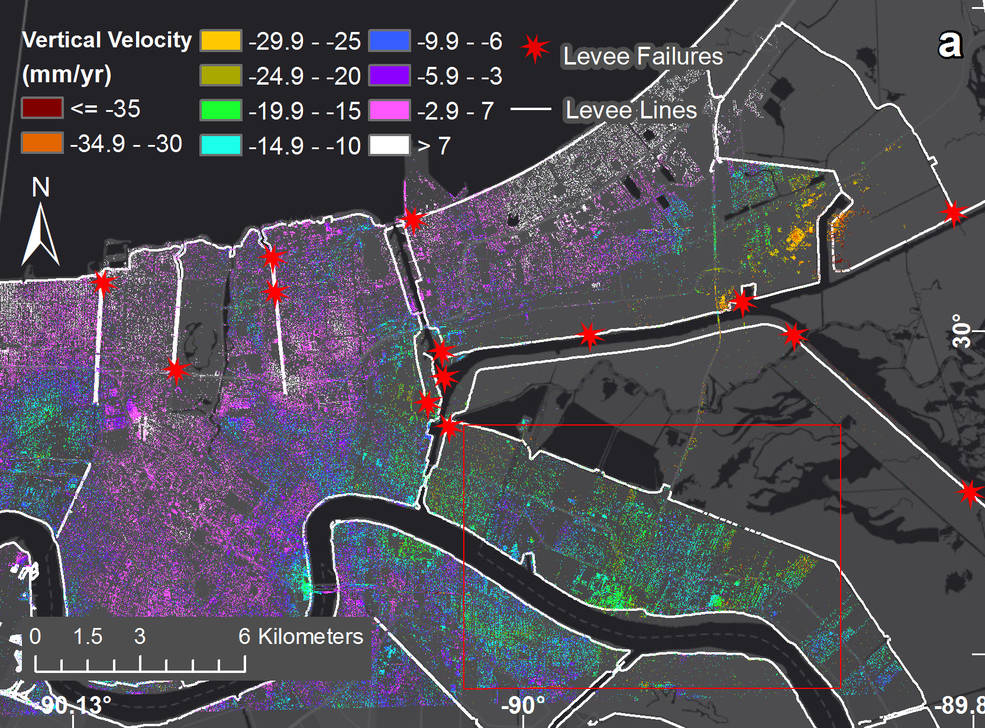
Subsidence rates in New Orleans as measured by NASA’s UAVSAR instrument from June 2009 to July 2012. The red stars represent locations where levees breached during Hurricane Katrina. Credits: NASA/JPL-Caltech, Esri
NASA has a press release out about a new study published in the AGU’s Journal of Geophysical Research: Solid Earth.
From the press release:
New Orleans and surrounding areas continue to sink at highly variable rates due to a combination of natural geologic and human-induced processes, finds a new NASA/university study using NASA airborne radar.
The observed rates of sinking, otherwise known as subsidence, were generally consistent with, but somewhat higher than, previous studies conducted using different radar data.
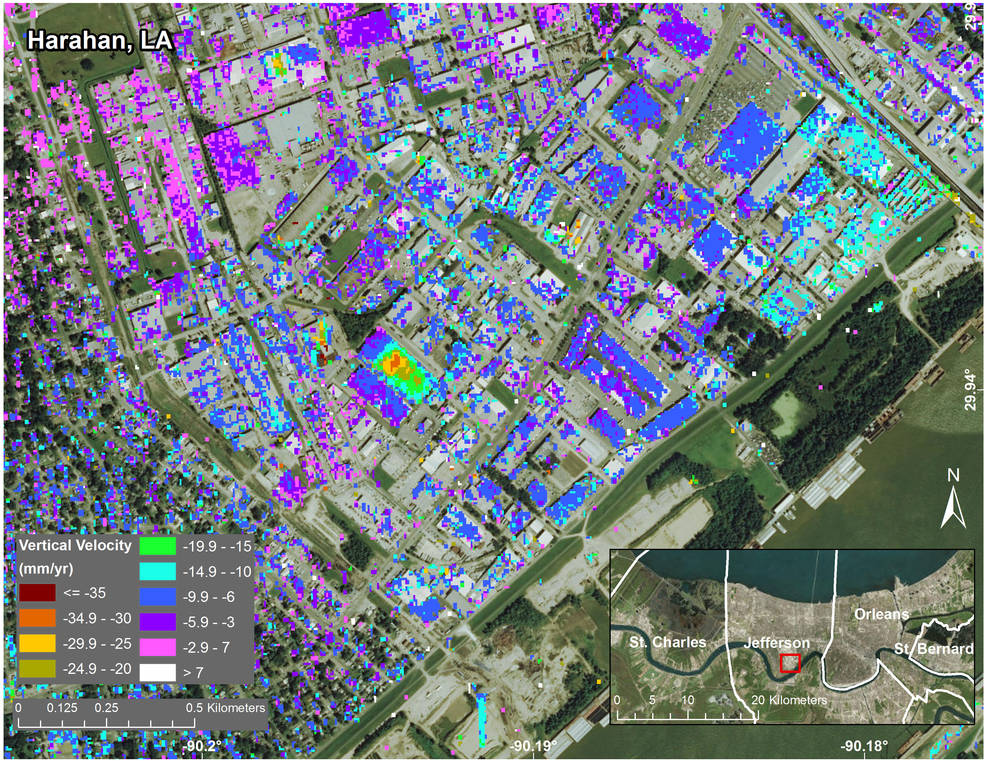
Subsidence in Jefferson Parish, Louisiana, from June 2009 to July 2012, as seen by NASA’s UAVSAR instrument. The measured displacements are a combination of movement of the ground and of individual structures. The inset at lower right shows the parish location within Greater New Orleans. Credits: NASA/JPL-Caltech, Esri
The research was the most spatially-extensive, high-resolution study to date of regional subsidence in and around New Orleans, measuring its effects and examining its causes. Scientists at NASA’s Jet Propulsion Laboratory, Pasadena, California; UCLA; and the Center for GeoInformatics at Louisiana State University, Baton Rouge, collaborated on the study, which covered the period from June 2009 to July 2012.
The highest rates of sinking were observed upriver along the Mississippi River around major industrial areas in Norco, and in Michoud, with up to 2 inches (50 millimeters) a year of sinking. The team also observed notable subsidence in New Orleans’ Upper and Lower 9th Ward, and in Metairie, where the measured ground movement could be related to water levels in the Mississippi. At the Bonnet Carré Spillway east of Norco — New Orleans’ last line of protection against springtime river floods overtopping the levees — research showed up to 1.6 inches (40 millimeters) a year of sinking behind the structure and up to 1.6 inches (40 millimeters) a year at nearby industrial facilities.
While the study cites many contributing factors for the regional subsidence, the primary contributors were found to be groundwater pumping and dewatering (surface water pumping to lower the water table, which prevents standing water and soggy ground). JPL scientist and lead author Cathleen Jones said study results will be used to improve models of subsidence for the Mississippi River Delta that decision makers use to inform planning.
To fully and accurately measure and predict future subsidence in and around New Orleans, it’s necessary to better understand the various natural and human-produced processes contributing to the sinking. Those include withdrawal of water, oil and gas; compaction of shallow sediments; faulting; sinking of Earth’s crust from the weight of deposited sediments; and ongoing vertical movement of land covered by glaciers during the last ice age. Jones said the comprehensive subsidence maps produced by this study, with their improved spatial resolution, help scientists differentiate these processes.
The maps were created using data from NASA’s Uninhabited Aerial Vehicle Synthetic Aperture Radar (UAVSAR), which uses a technique known as interferometric synthetic aperture radar (InSAR). InSAR compares radar images of Earth’s surface over time to map surface deformation with centimeter-scale precision. It measures total surface elevation changes from all sources — human and natural, deep seated and shallow. Its data must be carefully interpreted to disentangle these phenomena, which operate at different time and space scales. UAVSAR’s spatial resolution makes it ideal for measuring subsidence in New Orleans, where human-produced subsidence can be large and is often localized.
Jones said another key advantage of this study is that UAVSAR enabled better resolution of small-scale features than previous studies. “We were able to identify single structures or clusters of structures subsiding or deforming relative to the surrounding area,” she said.
 Dan Satterfield has worked as an on air meteorologist for 32 years in Oklahoma, Florida and Alabama. Forecasting weather is Dan's job, but all of Earth Science is his passion. This journal is where Dan writes about things he has too little time for on air. Dan blogs about peer-reviewed Earth science for Junior High level audiences and up.