
21 October 2015
September Global Heat Record Smashed. 2015 Will Almost Certainly Pass 2014 as Hottest on Record
Posted by Dan Satterfield
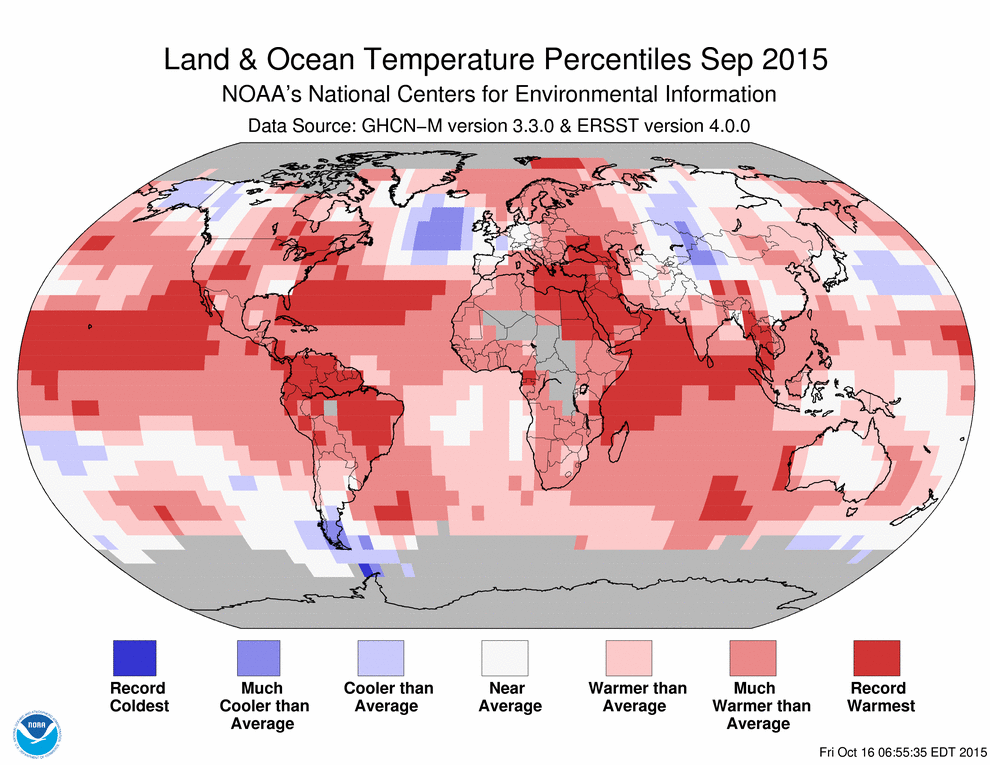
September 2015 was not just the hottest September since measurements began over 136 years ago, and it was farther above average than any other month on record. The amount above average was 0.9C, with the previous record holders coming this year as well.
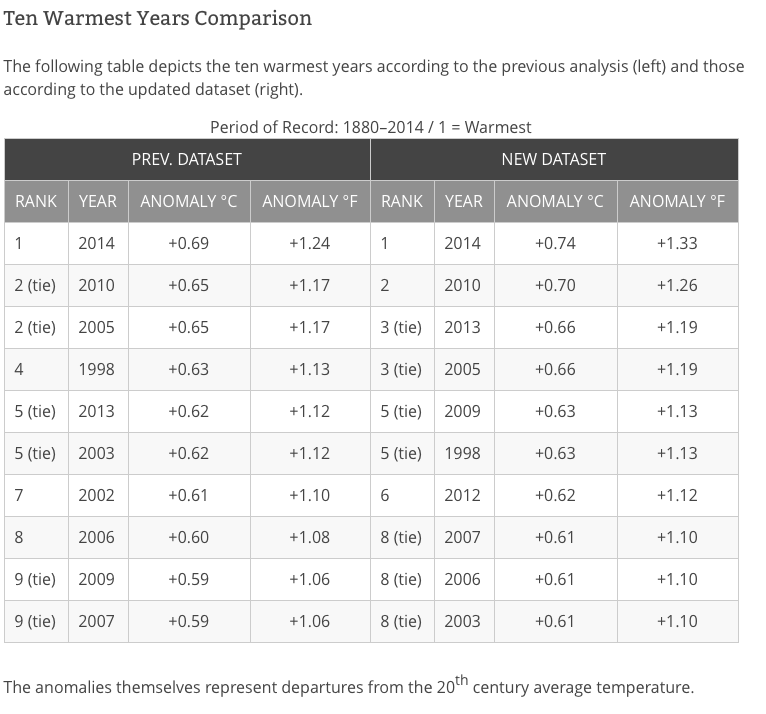
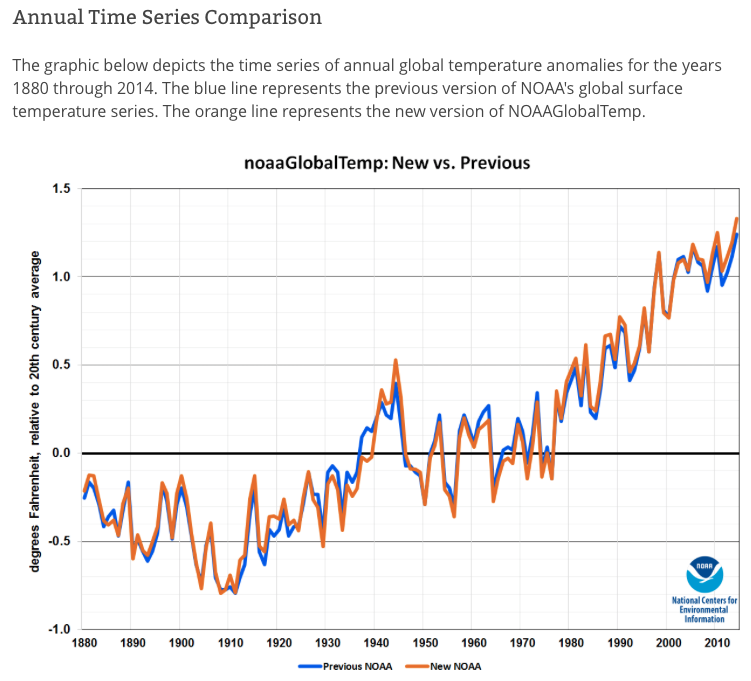
It’s not just a new record hot month, but a record that passed the old one by an astounding amount. The year to date is also the warmest on record, (and by an equally astounding amount) making it virtually certain that 2015 will pass 2014 as the hottest on record globally. What’s even more astounding is that the top ten years were all in the last 17 years of the record! The odds of this being the case, if the warming were a natural cycle, are infinitesimally small. NOAA is constantly improving the historical temperature record and recently updated it. The graphics below compare the previous data set with the current one.
Here is more from the National Climate Data Center on the heat of September and the year so far:
(From NCDC) Global highlights: September 2015
- The September average temperature across global land and ocean surfaces was 1.62°F (0.90°C) above the 20th century average&mdash. This was the highest September temperature on record, surpassing the previous record set last year by +0.12°F (+0.19°C). September’s high temperature was also the greatest rise above average for any month in the 136-year historical record, surpassing the previous record set in both February and March this year by 0.02°F (0.01°C).
- The September globally-averaged land surface temperature was 2.09°F (1.16°C) above the 20th century average. This was also the highest for September in the 1880–2015 record, surpassing the previous record set in 2009 by +0.16°F (+0.09°C). Record warmth was observed across much of South America and parts of Africa, the Middle East, Europe, and Asia.
- The September globally-averaged sea surface temperature was 1.46°F (0.81°C) above the 20th century average. This was the highest temperature for September in the 1880–2015 record, surpassing the previous record set in 2014 by +0.13°F (+0.07°C).
- On September 11th, Arctic sea ice reached its annual minimum extent at 1.70 million square miles, the fourth smallest extent in the 1979–2015 satellite record, according to the National Snow and Ice Data Center. This was 699,000 square miles below the 1981–2010 average, but 394,000 square miles larger than the record small minimum that occurred in 2012.
- The average Arctic sea ice extent for September 2015 was 720,000 square miles (28.88 percent) below the 1981–2010 average. This was the fourth smallest September extent since records began in 1979, according to analysis by the National Snow and Ice Data Center using data from NOAA and NASA. Below-average sea ice was observed across most regions of the Arctic, while near-average sea ice was observed in the Barents Sea.
- Antarctic sea ice extent during September 2015 was 100,000 square miles (0.53 percent) below the 1981–2010 average. This was the 16th smallest Antarctic sea ice extent on record and smallest since 2008.
Global highlights: Year-to-date (January–September 2015)
- The year-to-date temperature across global land and ocean surfaces was 1.53°F (0.85°C) above the 20th century average. This was the highest for January–September in the 1880–2015 record, surpassing the previous record set in 2014 by 0.19°F (0.12°C).
- The year-to-date globally-averaged land surface temperature was also the highest for January–September in the 1880–2015 record at 2.32°F (1.29°C) above the 20th century average. This value surpassed the previous record of 2007 by 0.31°F (0.17°C).
- The year-to-date globally-averaged sea surface temperature was 1.24°F (0.69°C) above the 20th century average and the highest for January–September in the 1880–2015 record. This value surpassed the previous record of 2010 by +0.11°F (+0.06°C).
I’ll have some more context on this in the next post, with a look at how our current temps. look compared to much farther back in time using paleo climate records.
 Dan Satterfield has worked as an on air meteorologist for 32 years in Oklahoma, Florida and Alabama. Forecasting weather is Dan's job, but all of Earth Science is his passion. This journal is where Dan writes about things he has too little time for on air. Dan blogs about peer-reviewed Earth science for Junior High level audiences and up.
From 1972 to 2014 the global temperature increased ca 1.25C or 0.03C /year. If so the critical global temperature of 2deg.C above the average 20th century global temperature will be reach circa 2080, assuming a linear rate of increase. If it turns exponential as a result of increased methane release from muskeg and oceanic hydrates our goos may be cooked as early as 2050.