13 December 2016
Arctic Warmth is the Talk of the AGU Meeting In San Francisco. You Can See Many Talks Online.
Posted by Dan Satterfield

 Wishing you could attend the big American Geophysical Union meeting in San Francisco? I couldn’t make it this year either, but just click on the image above to watch many of the major talks at one of the world’s largest science meetings (some are live, and others are on demand). A LOT of science news will come out of here this week, and just today the 2016 Arctic Report Card was released, with the key findings are below:
Highlights
- The average surface air temperature for the year ending September 2016 is by far the highest since 1900, and new monthly record highs were recorded for January, February, October and November 2016.
- After only modest changes from 2013-2015, minimum sea ice extent at the end of summer 2016 tied with 2007 for the second lowest in the satellite record, which started in 1979.
- Spring snow cover extent in the North American Arctic was the lowest in the satellite record, which started in 1967.
- In 37 years of Greenland ice sheet observations, only one year had earlier onset of spring melting than 2016.
- The Arctic Ocean is especially prone to ocean acidification, due to water temperatures that are colder than those further south. The short Arctic food chain leaves Arctic marine ecosystems vulnerable to ocean acidification events.
- Thawing permafrost releases carbon into the atmosphere, whereas greening tundra absorbs atmospheric carbon. Overall, tundra is presently releasing net carbon into the atmosphere.
- Small Arctic mammals, such as shrews, and their parasites, serve as indicators for present and historical environmental variability. Newly acquired parasites indicate northward sifts of sub-Arctic species and increases in Arctic biodiversity.
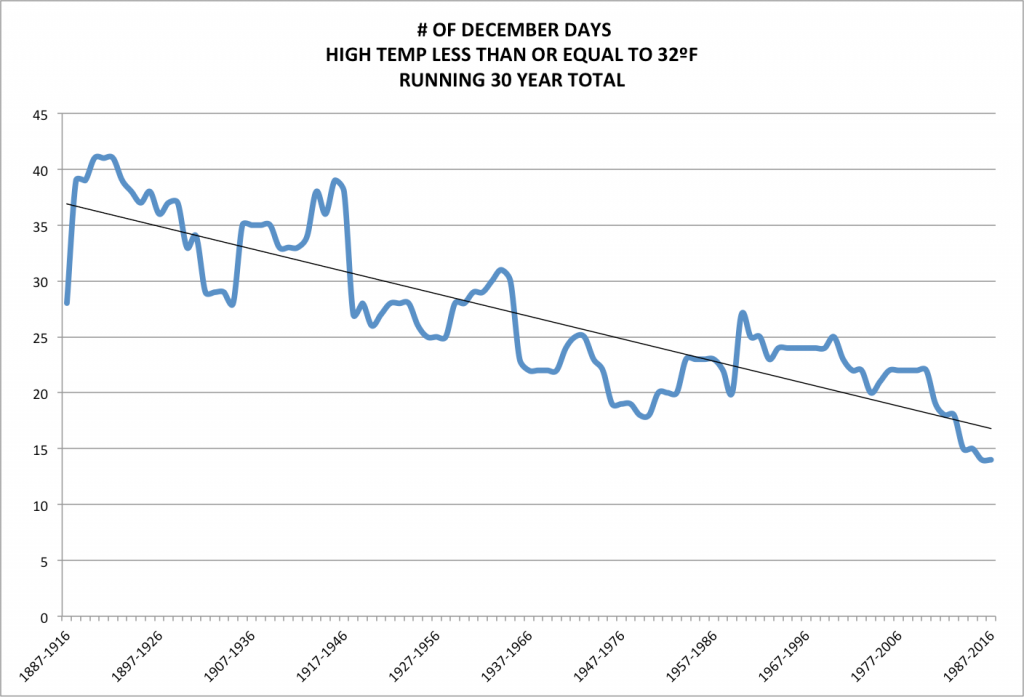
With a real outbreak of Arctic air coming this week, you may hear something along the lines of “Where’s the global warming?” from someone. YOU probably know how silly that question is, but they don’t. The graph below from my friend (and fellow Meteorologist) Greg Fishel at WRAL-TV in Raleigh, is the perfect response to that question. He plotted a running 30 year total of the number of December days at or below 32 degrees in Raleigh. Most people are very poor at recognizing slow motion disasters…
 Dan Satterfield has worked as an on air meteorologist for 32 years in Oklahoma, Florida and Alabama. Forecasting weather is Dan's job, but all of Earth Science is his passion. This journal is where Dan writes about things he has too little time for on air. Dan blogs about peer-reviewed Earth science for Junior High level audiences and up.