13 October 2011
The Kentucky Smudge Explained
Posted by Dan Satterfield
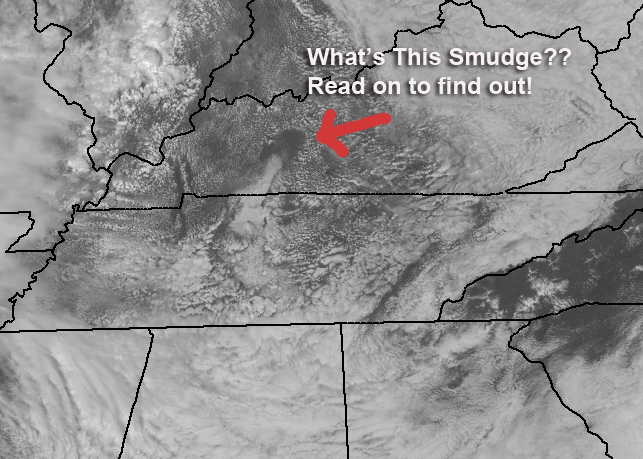
 While working on the forecast today, I called up this 1km resolution visible image from the GOES East (From NASA MSFC) and immediately spotted this weird-looking smudge. I knew pretty quickly what it was and how it happened, but the exact details took a little work and involve some very basic thermodynamics. My fellow meteorologist Brandon Chambers took a hard look at it while I worked on the forecast for the 5 PM newscast and he gets the award for getting to the absolute bottom of it!
First of all, what you’re looking at is a clear spot surrounded by cumulus clouds. The cloud at the bottom of the spot is a real clue to the origin of the smudge and if you’ve heard of “hole punch” clouds, this isn’t one; It’s far too large. The clue to the answer is temperature (and more specifically) it’s cooler in the smudge than it is around it.

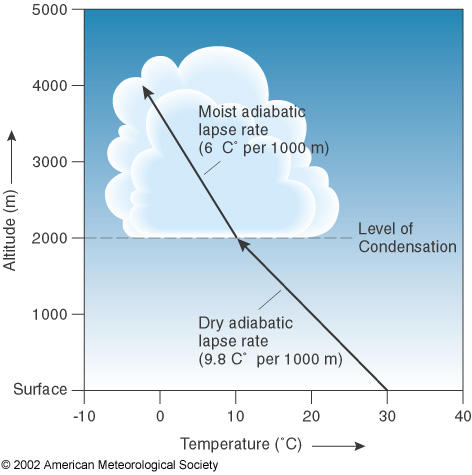
The base of the cloud is at the Lifted Condensation level. You can read more about it by clicking on the image.
Think of walking outside on a misty morning, with bright sunshine and clear skies. Later on, as it warms up, you start to see some puffy cumulus clouds fill the sky and they last until near sunset when the skies become clear again. These are fair weather cumulus and are caused by bubbles of warm air rising from the sun heated ground. A parcel of air that is warmer than its surroundings is buoyant and will rise as long as it stays warmer than the surrounding air. The parcel will cool at a rate of 9.8 degrees C per 1000 meters, and meteorologists call this the dry adiabatic lapse rate.
As it cools, the parcel of air can “hold” less water vapor and it finally reaches a point where more water vapor is condensing than is evaporating and a cloud forms. The level at which this happens is called the LCL- Lifted Condensation Level. It’s actually fairly easy to determine what the LCL is by looking at a weather balloon sounding and using a diagram called a skew T-Log P. Once the air is saturated, the parcel will cool at a slower rate (because heat is released) as more water vapor condenses out.
I should also point out that the moisture would condense if there was only water vapor alone, and no oxygen or nitrogen present! The air really does not “hold” the water vapor, but it’s not a bad way to think about it by saying colder air can hold less water vapor than warmer air. We are making an additional HUGE assumption here and it is this: there is no mixing of the air between the parcel and the surrounding air. This is obviously not true but this assumption works pretty well most of the time!
So now, here’s what’s causing that smudge to show up. The air is cooler there, and the temperature has not warmed up enough to cause the rising air parcels to reach the LCL.
Why is it cooler you ask?
The answer is that there was dense fog in that area and it was probably thicker because of the local topography. The fog burned off later there and the region in the clear spot was running cooler than the sunny areas around it. Brandon had to look at some high-resolution loops of the area to pick out the fog but it was there! My first guess was a thick low or mid level cloud deck over the area, but the fog is the most likely!
Note: When I first posted this I used LFC instead of LCL. LFC is the level of free convection which is different from LCL. I’ll do a post on the LFC soon. It is another of those fascinating aspects of forecasting that I just love.


 Dan Satterfield has worked as an on air meteorologist for 32 years in Oklahoma, Florida and Alabama. Forecasting weather is Dan's job, but all of Earth Science is his passion. This journal is where Dan writes about things he has too little time for on air. Dan blogs about peer-reviewed Earth science for Junior High level audiences and up.