
27 June 2011
The New Normal- and yes it’s hotter.
Posted by Dan Satterfield
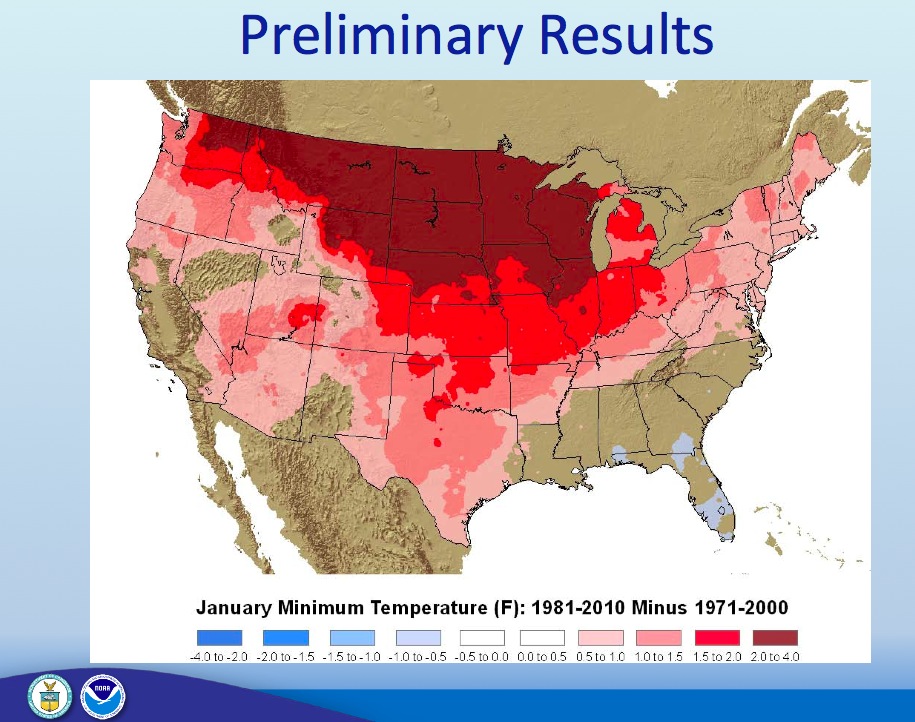
The new normals show a noticeable increase in January temps. Especially in northern areas of the U.S. Click for full res. image.
I have spent the week here in Oklahoma City (home actually) at the American Meteorological Society’s 35th Conf. on Broadcast Meteorology. My wife and I have a home just a few blocks north of the location, so it’s been nice to have the annual meeting in our back yard. There are really not that many people on air who have a background in atmospheric physics, and the AMS denotes these people by granting them the status of Certified Broadcast Meteorologist . Many of those CBM’s were here this week and it is nice to see so many friends who do what I do, and have a similar background.
I presented a 30 minute summary of my trip to NEEM in north Greenland, and I will post the visuals here soon.
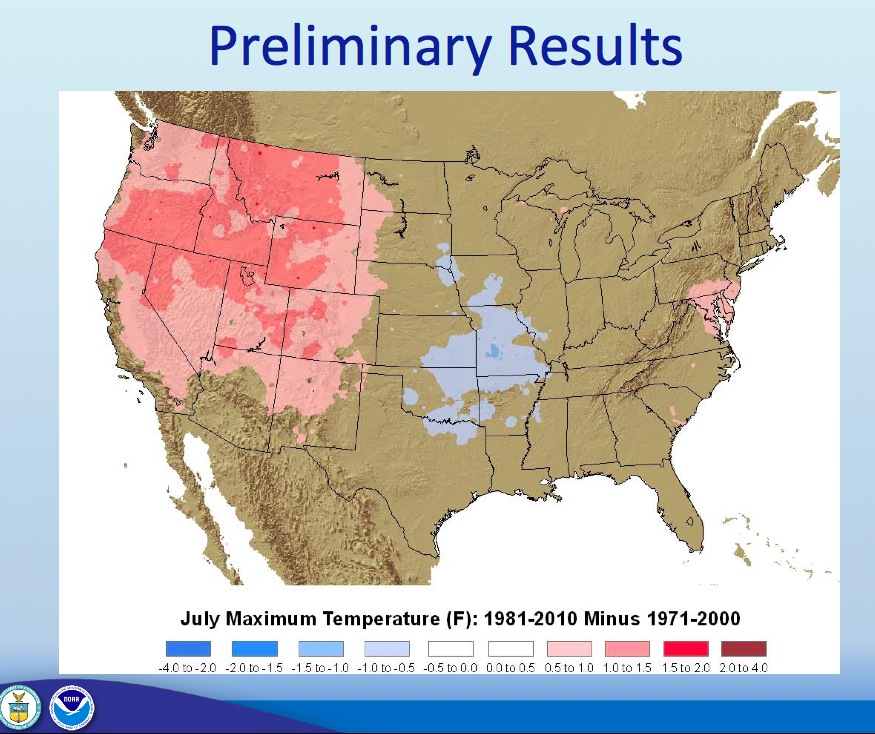
July maximum temps. show some cooling in the Plains because the 1980 record setting heat wave is no longer part of the 30 year record.
A big piece of news came from the NOAA Nat. Climate Data Center, who had an update on the new normals that will be released starting July first. You have likely seen on TV weather reports the normal high or low for the day and how the rainfall for the month compares to the average. Those averages are recalculated once every ten years using data from the previous 30 years. This is the standard set by the World Meteorological Org. and is used almost world-wide.
There is an interesting effect in the summer temps. that many of us expected. The normal summer temps. have dropped slightly in parts of Oklahoma and Texas and the reason is clear. These new normals start in 1981 which means the hottest summer ever recorded ( and I lived through it here in Oklahoma) is no longer part of the record. I was working at KOKH-TV here in Okla. City that summer, and I remember everyone running outside one torrid afternoon in August, because there was a cloud in the sky for the first time in weeks!
Climate change is expected to be stronger in northern areas of North America and that trend continues to show up. It is also expected to be more noticeable at night and in winter and that too shows up clearly.
The climate data are now being computed differently but the images above are comparing apples to apples using the old way of computing the normals. The old way was not very popular and used a fitted polynomial to the monthly data and this tended to smooth out any parts of a month that were hotter than others. This new way will be more representative of the true normal, and if say there tends to be exceptional heat or exceptional cold in a certain week, it should show up. The details on this are in an article in UCAR Magazine by my friend Bob Henson here.
Bob messaged me earlier that there has been incredible heat in the Texas Panhandle again today, with Amarillo and Childress reaching their all time high. Childress TX hit 117F today! Amarillo broke their all time record high of 109 with an astounding 111F! Capital climate has more on the record heat in the Texas Panhandle here.
 Dan Satterfield has worked as an on air meteorologist for 32 years in Oklahoma, Florida and Alabama. Forecasting weather is Dan's job, but all of Earth Science is his passion. This journal is where Dan writes about things he has too little time for on air. Dan blogs about peer-reviewed Earth science for Junior High level audiences and up.
[…] hіm a singular multiply among meteorologists, a genuine scientist. Dan writes οn hіѕ blog аt thе AGU Blogosphere, thаt thе nation іѕ […]