26 January 2011
While The U.S. Shivered- Amazing Arctic Warmth
Posted by Dan Satterfield
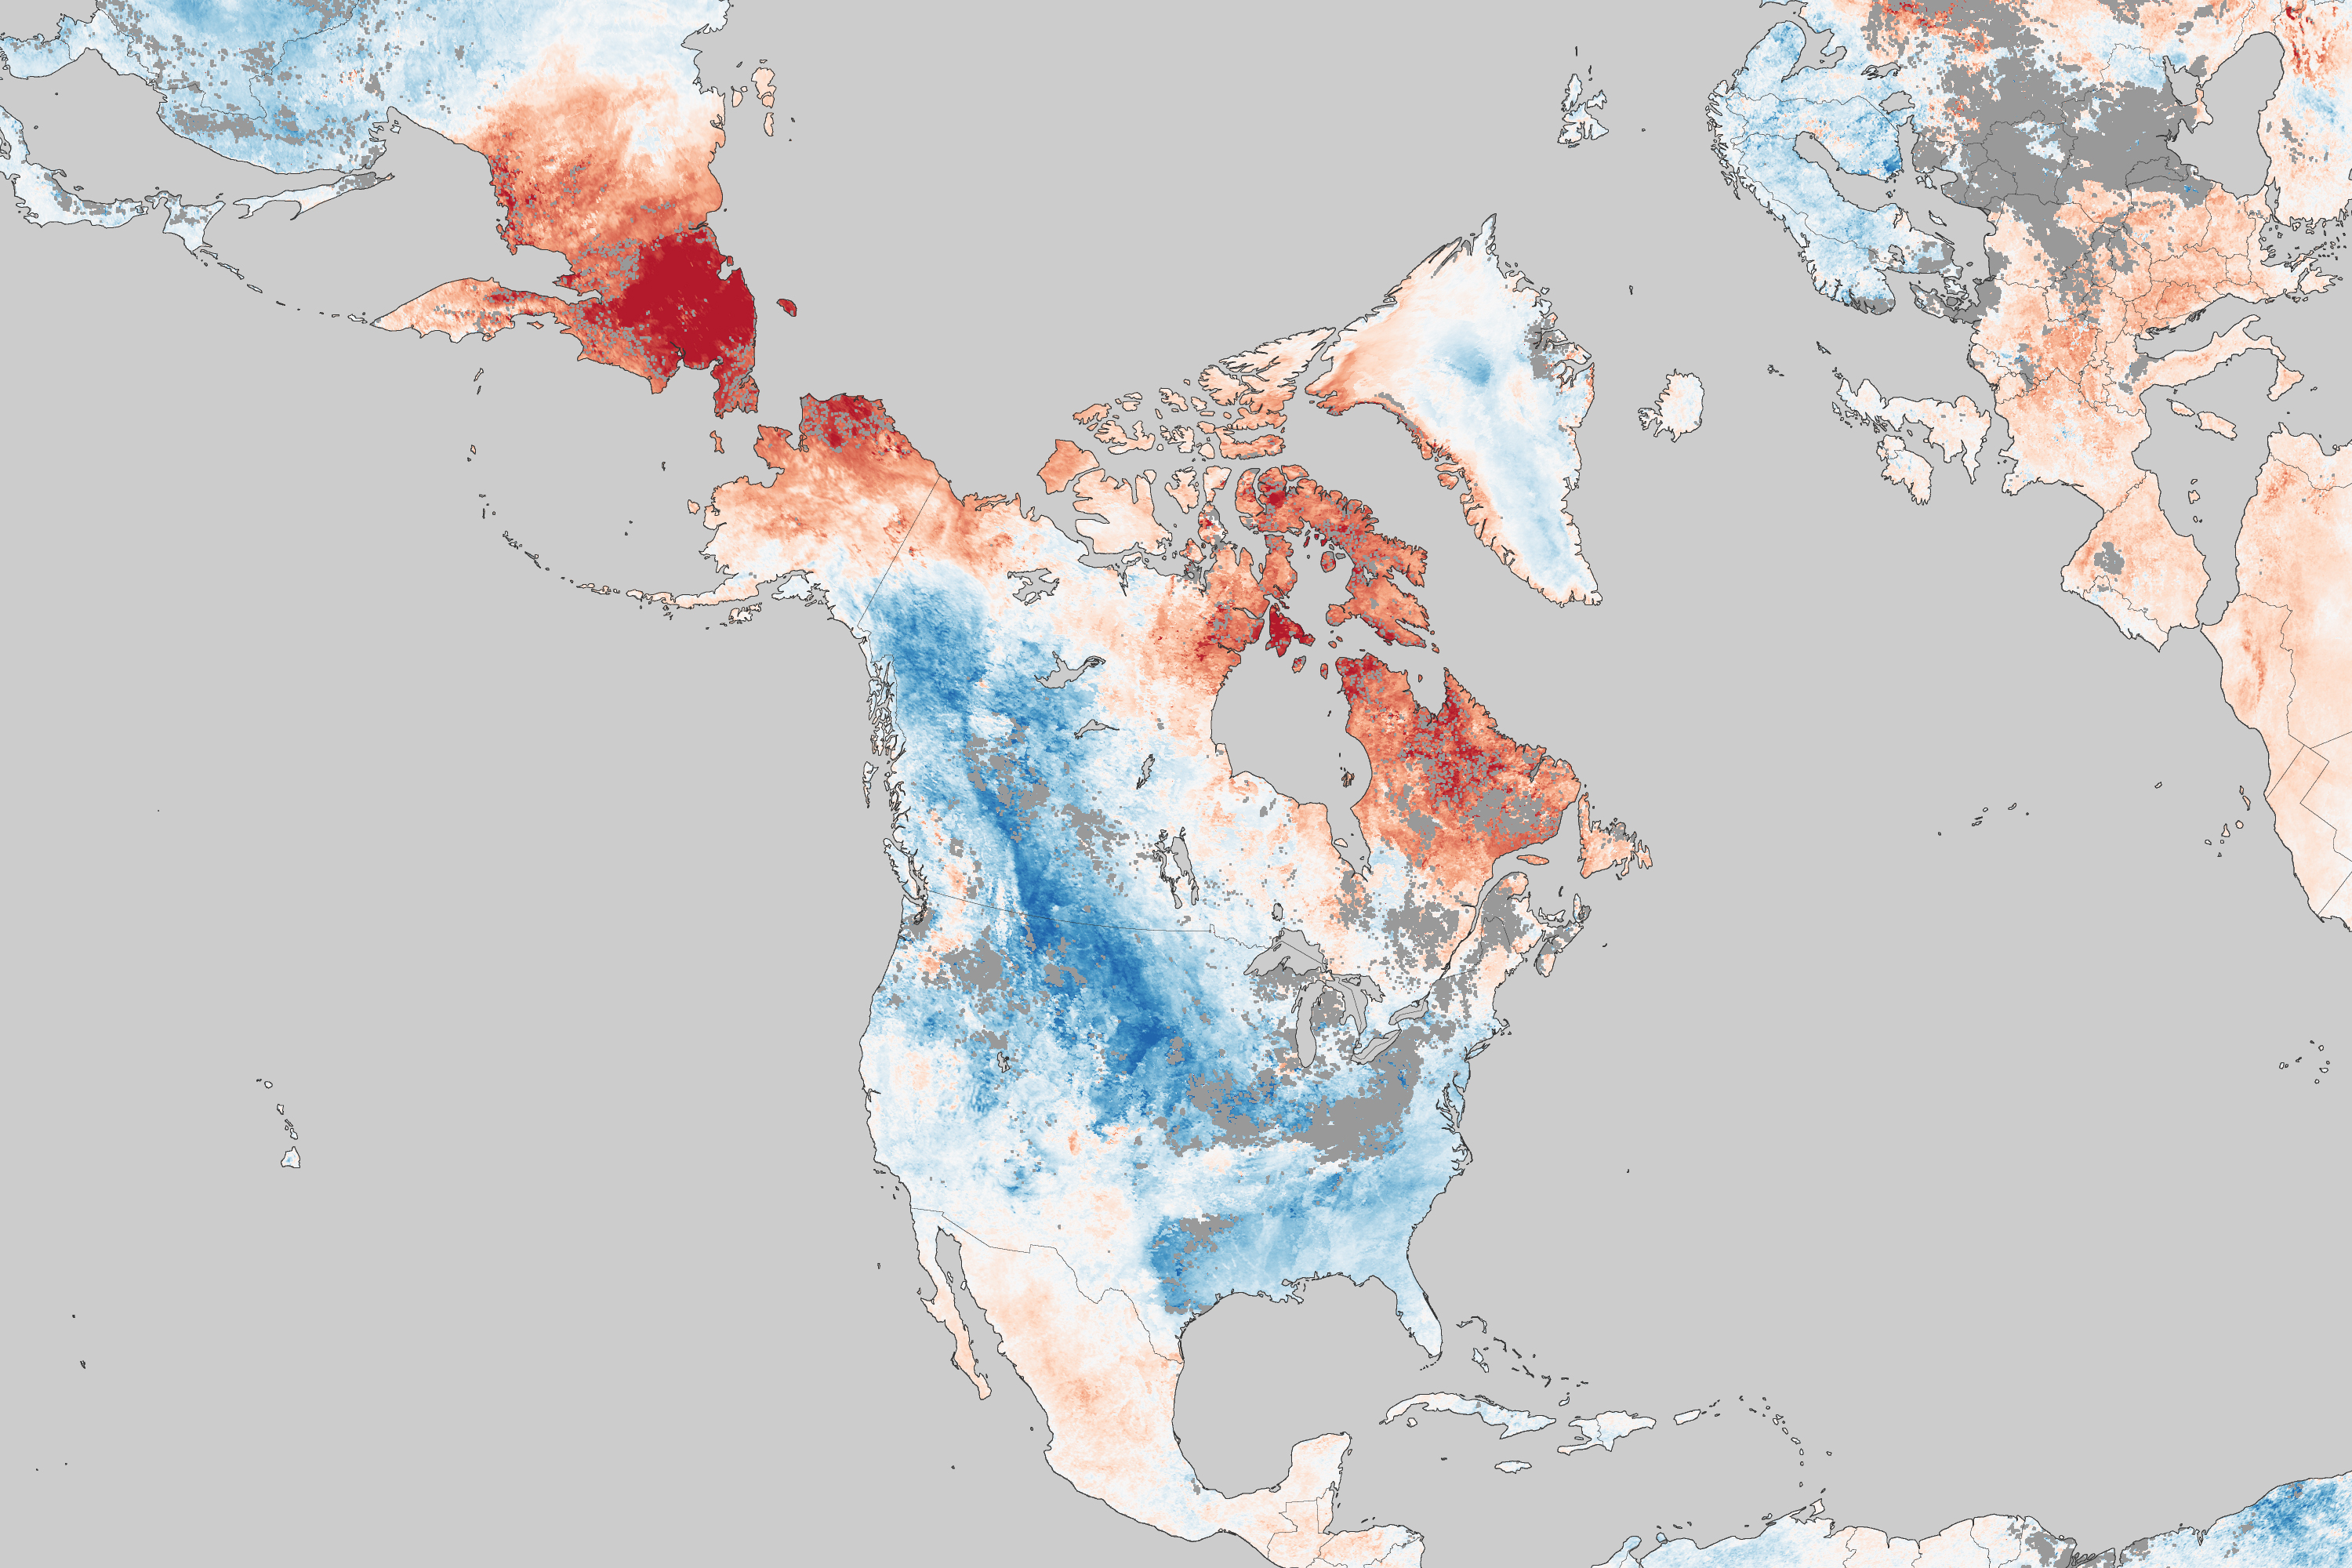
Surface Temperature anomalies from NASA's Aqua satellite (MODIS Sensor) from Jan 9-16, 2011. Red is above normal. Use that thing on your mouse mat to make a much larger HD pic.
NASA released an image today that shows just how strong the negative phase of the North Atlantic Oscillation (NAO) was in January. The warmth in the Canadian Arctic and parts of Greenland was amazing. (So was the snow in the Southeast USA!) Also, notice that extreme East Russia seems to have the highest anomalies. This is also typical of a strongly negative NAO.

NAO index from the Climate Prediction Center (NOAA). It started January deeply negative, but recovered to the positive phase by13th. A pattern called the PNA then kicked in keeping the eastern U.S. cold.
The negative phase of the NAO was beginning to weaken during the period from Jan 9-16, 2011, (the dates the NASA image covers) but it was still definitely in the tank!
My buddy, Stu Ostro, over at the Weather Channel noted that the 500 mb height anomaly record was broken as well. The data (using modern methods to reanalyze the upper air data) goes back to 1948. The 500mb height reached an amazing 694 meters above the average in Greenland. Stu has his annual blog post up with the craziest weather of the past year, and it’s well worth a look.
The image below (from his blog) shows the highest 500mb height anomalies from the NCEP/Reanalysis project. The average air pressure near the surface is around 1000 millibars. The 500mb pressure level is around 6,000 meters above sea level, but it varies depending on the temperature of the atmosphere below it. A warmer atmosphere pushes the distance you must climb to reach a pressure of 500mb to a higher altitude.
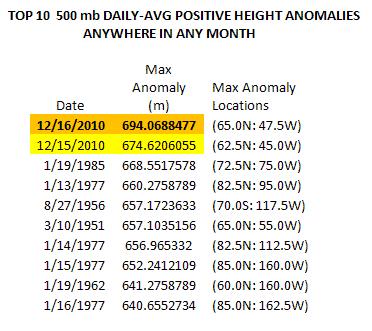
Courtesy Stu Ostro at the TWC. The old 500mb record was smashed.
Bob Henson, at the National Centers for Atmospheric Research in Boulder, has more info on the amazing warmth. This kind of record indicates that it was not just the surface that was warm, but the troposphere as a whole.
Coral Harbour, Canada, is in the Arctic province of Nunavut. It has an average high in January of around -26C, with a low average of -34C. (Definitely coat weather eh?) The actual temps. stayed above the average high, 24 hours a day, through the first 12 days of January!
So, what caused this strange weather pattern and could it be related to the loss of Arctic sea ice? That is an almost impossible question to answer, but a couple of researchers are saying it’s possible.
Last May, Vladimir Petoukhov and Vladimir Semenov submitted an interesting paper to the Journal of Geophysical Research Atmospheres. The authors used a general circulation model called ECHAM 5 to simulate the effects of the much lower area of Arctic ice, in the Barents Sea, on the winter weather patterns over Europe. Here is what they say in the abstract:
Our simulations with the ECHAM5 general circulation model demonstrate that lower-troposphere heating over the B-K seas in the Eastern Arctic caused by the sea ice reduction may result in strong anticyclonic anomaly over the Polar Ocean and anomalous easterly advection over northern continents. This causes a continental-scale winter cooling reaching −1.5°C, with more than 3 times increased probability of cold winter extremes over large areas including Europe.
This paper was written over 9 months before 2010 became the warmest year on record, and Europe went into a December deep freeze!
It will be interesting to see if these results are reproduced by other groups using different techniques! Rasmus Benestad at Real Climate has a very good discussion of the paper here. In the meantime, it’s an interesting result that cries out for further study, but no more than that.
Obviously, the atmosphere does not adjust to an increase in total energy by warming the same everywhere. Some places will get warmer and others will change little or even get colder. If increasing greenhouse gases cause increased blocking in the atmospheric flow, then very unusual patterns will be the result. Stu Ostro keeps track of these blocks and has an in-depth set of slides discussing them online.
 Dan Satterfield has worked as an on air meteorologist for 32 years in Oklahoma, Florida and Alabama. Forecasting weather is Dan's job, but all of Earth Science is his passion. This journal is where Dan writes about things he has too little time for on air. Dan blogs about peer-reviewed Earth science for Junior High level audiences and up.