16 May 2012
Contemplating the IARC-JAXA graph
Posted by Callan Bentley
One of the ~350 or so blogs I subscribe to is Arctic Sea Ice by Neven. Today, he put up a post highlighting new daily data from IARC-JAXA, a collaboration between the International Arctic Research Center (IARC) at the University of Alaska-Fairbanks and the Japan Aerospace Exploration Agency (JAXA). Check it out. Here’s a couple of things I was struck by:

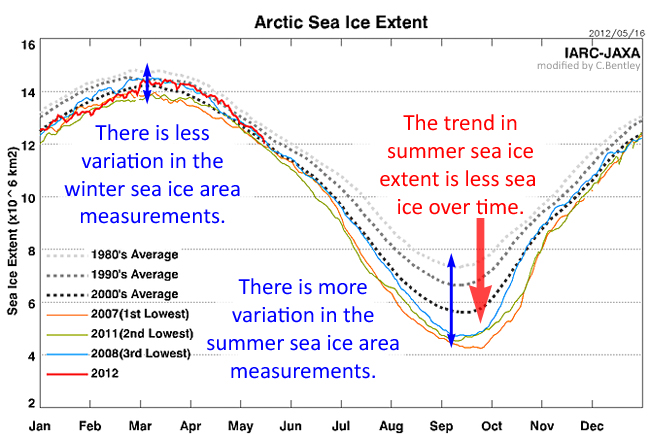
The annual variation between summer and winter ice cover is about 10 million square kilometers of sea ice, with around 14 million at the peak of winter cover, and a minimum that approaches 4 million late in the boreal summer. That’s a lot of variation, but that variation is the consequence of the seasons. The amount of annual variation is increasing, however: look at the light gray line for the 1980’s average: that only varied by about 8 million square kilometers of area in a six-month span. In fact, the peak winter numbers are still tightly clustered: there is less variation there than there is to the minimum summer numbers. Compare the spread of the data at the peak and the trough of this dataset. Lastly, there is a clear trend in the decadal data, showing decreasing summer ice cover of the Arctic Ocean. What’s your prediction for the minimum sea ice cover this year? What’s your prediction for the 2010’s average, as compared to the previous 3 decades?
Subscribe to Neven’s blog, and watch as the data unfurls in real time. It’s a fascinating phenomenon to watch from the comfort of your computer screen – both the natural annual variability in this remote system, and the signature of climate change that is driving the system into new territory.


 Callan Bentley is Associate Professor of Geology at Piedmont Virginia Community College in Charlottesville, Virginia. He is a Fellow of the Geological Society of America. For his work on this blog, the National Association of Geoscience Teachers recognized him with the James Shea Award. He has also won the Outstanding Faculty Award from the State Council on Higher Education in Virginia, and the Biggs Award for Excellence in Geoscience Teaching from the Geoscience Education Division of the Geological Society of America. In previous years, Callan served as a contributing editor at EARTH magazine, President of the Geological Society of Washington and President the Geo2YC division of NAGT.