24 February 2017
(Geo)science Matters: Snow surveys aren’t just for TV
Posted by Jessica Ball
Everyone (in California, at least) has seen those clips that get run every winter of the snow surveys: people walking out into a white-blanketed meadow to shove a pole into the snow and record the depth. Or, in the case of the 2015 broadcast, walking out onto muddy grass and gesturing sadly at a lack of snow in which to do this. It’s a good photo op, but the broadcasts rarely follow up with much of the science behind the survey.
It all boils down to water supplies. (Har, har…)
California is a big state. It’s also the source of two-thirds of the country’s fruits and nuts and a third of its vegetables. If you eat walnuts, celery, garlic, spinach, or artichokes, among other things, there’s a good chance they were grown in California. But all this agriculture takes water, which begs the question: Where does the water come from?
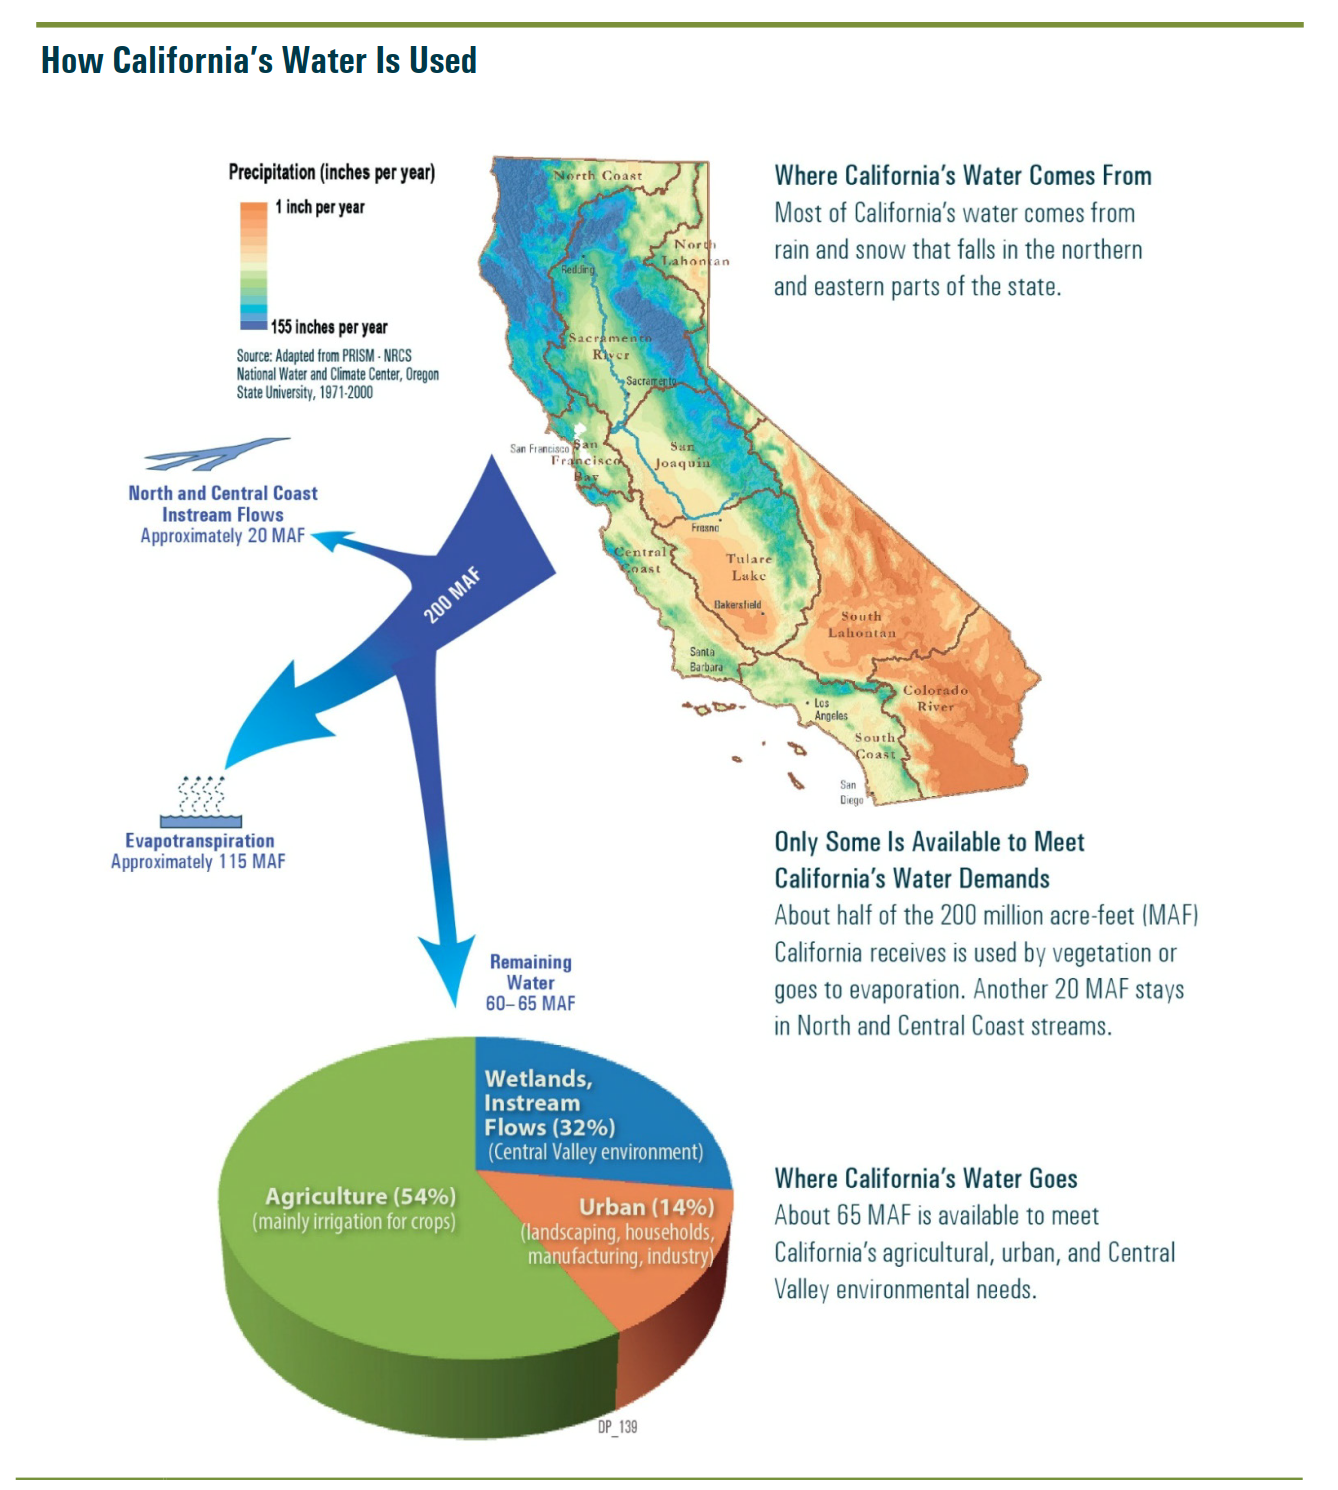
Figure 3-1 from the Delta Stewardship Council’s “Delta Plan” (http://deltacouncil.ca.gov/delta-plan-0)
In this state, a variety of places. Around 30% comes from groundwater. But more than 60% of the developed water supply comes from the Sierras, a third of which is stored in the state’s snowpack (what we call the snow that accumulates in the winter but doesn’t melt until spring).
In general, California’s snowpack is crucial for us to meet our water demands, and it needs to last until spring (which for surveying purposes is April 1). The snowpack surveys are conducted by a number of state and federal agencies, and they let us know how close we are to meeting that goal – or, when we have unusually warm weather that causes it to rain on higher elevations and melt the snow early, tells us how much of a deficit we’re running. This allows water managers all over the state to decide how best to divide up what is available, so we can all drink and shower and water our crops and feed our livestock and run cooling towers at power and manufacturing plants and wash dishes at restaurants…and on and on.
Conducting snowpack surveys helps state officials manage irrigation, reservoir operation, domestic water use, power generation, fisheries management, and flood control. These surveys require both on-the-ground and remote efforts, including using NASA satellites, university and government computer models, and ground-based snow sensor and survey data. Without even one of these components, we would have an incomplete picture of our state’s water resources, which in turn affects the people and industries who need to use water – namely, everyone in the state.
This year, thanks to some pretty spectacular storms, the snowpack is doing pretty well. Currently, we’re at 191% of normal:
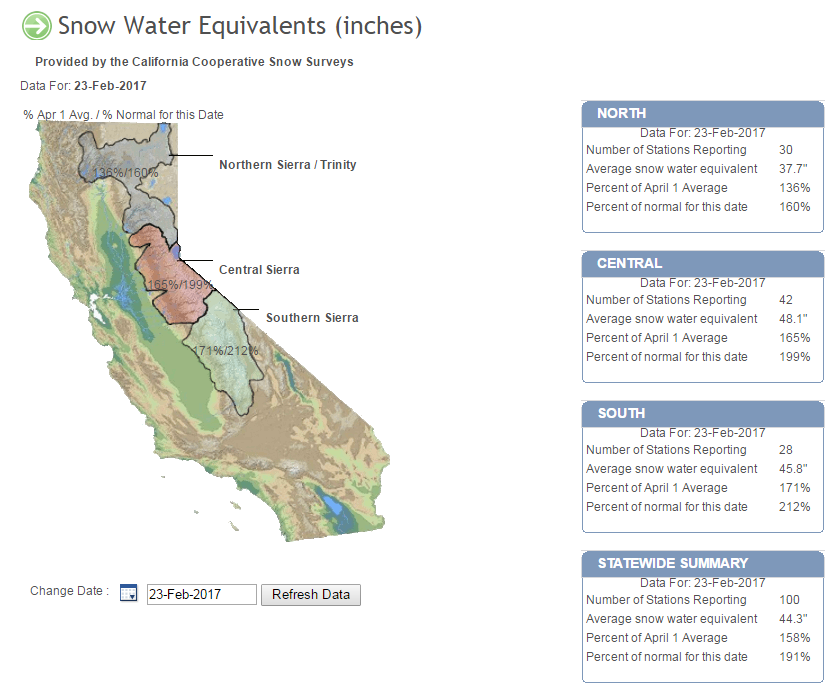
Snow Pack Conditions as of publication, from the CA Department of Water Resources: http://cdec.water.ca.gov/cdecapp/snowapp/sweq.action
The “Percent of April 1 Average” refers both to the historical tradition of gauging snow on April 1 and the hydrological reason that snow tends to stop accumulating and start melting around April 1 each year. Judging by current percentages, we’re doing pretty well – hopefully the news will still be good when April rolls around!
But the fact that we’re doing well this year doesn’t eclipse the knowledge that we’ve just experienced more than five years of drought, and we’re not completely out of it yet. Snowpack surveys are just one tool in geoscientists’ belt for managing water resources in the face of drought, but in California, they’re a very important one.
And yes, they also make for good TV.
More reading:
- “Storms filled 37 Percent of California’s Snow-Water Deficit” (NASA-JPL)
- “California snowpack reaches 173% of average, replenishing a third of state’s ‘snow-deficit'” (LA Times)
- Snow Pack Conditions (CA Department of Water Resources)
- California Cooperative Snow Surveys (CA Department of Water Resources)
- Snow Survey Procedure Manual (CA Department of Water Resources)
- California Drought Information (United States Geological Survey)
- Snow Surveys and Water Supply Forecasting (National Resources Conservation Service, part of the United States Department of Agriculture)
 Jessica Ball is a volcanologist at the U.S. Geological Survey, researching volcanic hydrothermal systems and stability, and doing science communication for the California Volcano Observatory. She previously worked at the Geological Society of America's Washington DC Policy Office, learning about the intersection of Earth science and legislative affairs. Her Mendenhall postdoc and PhD focused on how water affects the stability of volcanoes, and involved both field investigations and numerical modeling applications. Her blogging covers a range of topics, from her experiences in academic geosciences to science outreach and communication to her field and lab work in volcanology.