
26 April 2016
The distribution of landslides from the M=7.0 Kumamoto Earthquake
Posted by Dave Petley
The distribution of landslides from the M=7.0 Kumamoto Earthquake
With impressive efficiency, analyses are now appearing of the distribution of landslides triggered by the M=7.0 Kumamoto Earthquake, and its foreshock and aftershock sequence. The team at DPRI at Kyoto University have put a large body of information online (in Japanese, but Google Translate does a good job). I have tried to turn some of the explanation of the landslides into understandable English from the machine translation:
Many of the slope failures, occurred on tephra covering the slopes. Many of the collapses occurred on the steep part of the slopes with a gradient of more than 30°, such as the Aso caldera wall and the incised valley wall…Near to the Kyoto University research facilities, shear fracture on the gentle slopes of about 10 ° tilt occurred, with fluid sediment movement seeming to have happened. This is believed to be due to tephra containing water being subjected to ground motion, inducing liquefaction
The team have generated a stunning contour map with the earthquake-induce landslides highlighted in red:

Landslides from the M=7.0 Kumamoto Earthquake, as mapped by the team from DPRI Kyoto
.
Note the high incidence of landslides on the western wall of the caldera, and on the steep southern flanks of the volcano. The data are available as a (zipped) KML, so I have imported them into Google Earth along with the USGS seismic intensity contour data:
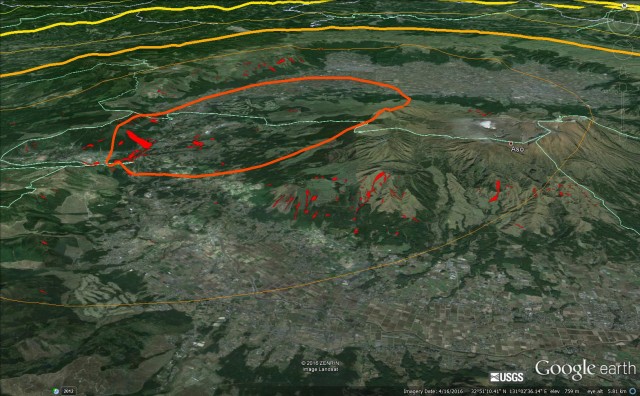
Google Earth visualisation of the DPRI-mapped landslides triggered by the M=7.0 Kumamoto Earthquake together with the USGS intensity data
.
This visualisation of the landslides from the M=7.0 Kumamoto Earthquake does help explain the distribution of slope failures. The highest density is in the area of intersection of the MMI=IX region and the steep slopes that mark the wall of the caldera. In the MMI=XIII zone landslides appear to have occurred in the tephra deposits on the southern edge of the volcanic complex. But note the boundaries of the area mapped on the contour image above – there may be further landslides to be found yet.
There is a great deal of work still to do on understanding these landslides, but the mapping work of this team is an amazing start.
Meanwhile, Japan Asia Group have placed an amazing digital elevation model (DEM) map online, showing the landslide at Mimami-Aso:
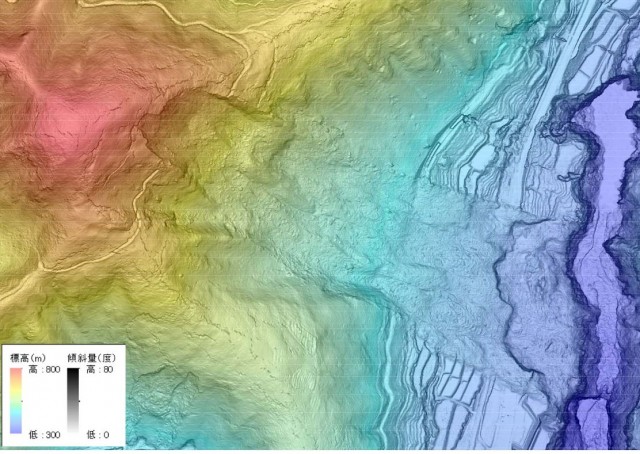
High resolution DEM data from the Japan Asia Group showing the Mimami-Aso landslide, triggered by the M=7.0 Kumamoto Earthquake
.
The most interesting aspect of this is the very extensive slope deformation around all of the ridges surrounding the actual failure, as evidenced by large numbers of cracks that the DEM data highlights beautifully.. In effect that landslide is part of a much larger landslide complex, However, experience tells us that although this situation looks extremely hazardous, these cracked slopes often prove to be more stable than one might expect. Thus, it is hard to say what will happen when heavy rainfall arrives. This is a site that will need both detailed investigation and active monitoring.
 Dave Petley is the Vice-Chancellor of the University of Hull in the United Kingdom. His blog provides commentary and analysis of landslide events occurring worldwide, including the landslides themselves, latest research, and conferences and meetings.
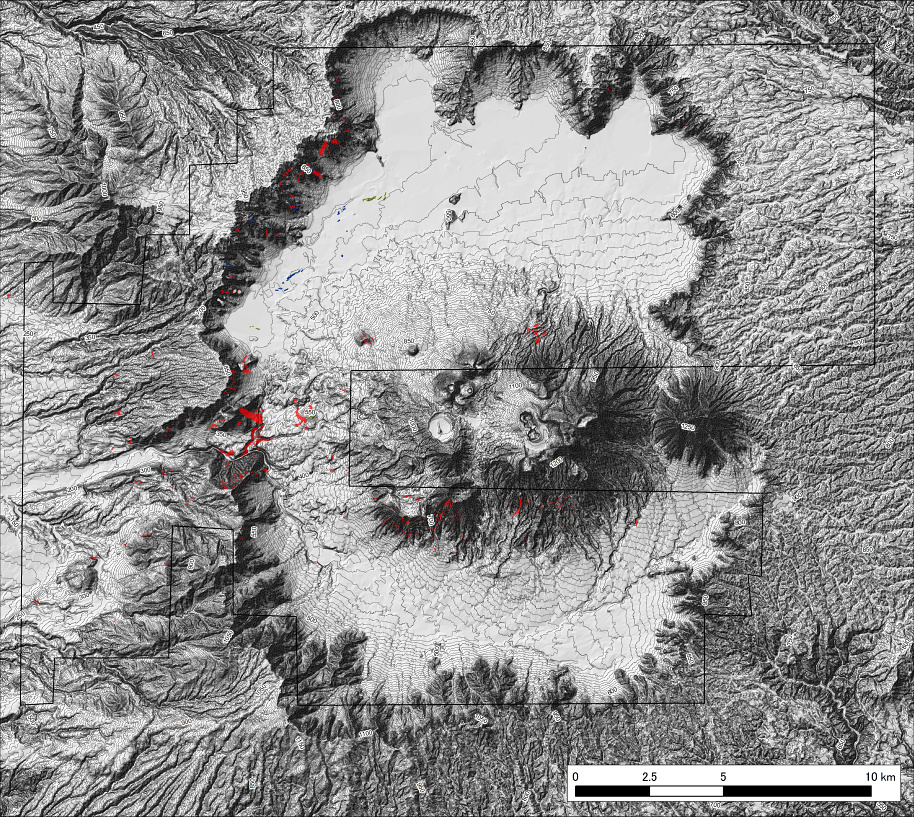