
3 August 2016
Researchers make first map of thawed areas under Greenland Ice Sheet
Posted by Lauren Lipuma
by Maria-Jose Viñas

The Greenland Ice Sheet is the second largest ice body in the world. NASA researchers have now produced the first map showing what parts of the bottom of the ice sheet are thawed.
Credit: Christine Zenino (CC BY 2.0 via Wikimedia Commons)
Researchers have produced the first map showing what parts of the bottom of the massive Greenland Ice Sheet are thawed – key information in better predicting how the ice sheet will react to a warming climate.
Greenland’s thick ice sheet insulates the bedrock below from the cold temperatures at the surface, so the bottom of the ice is often tens of degrees warmer than at the top, because the ice bottom is slowly warmed by heat coming from the Earth’s depths. Knowing whether Greenland’s ice lies on wet, slippery ground or is anchored to dry, frozen bedrock is essential for predicting how this ice will flow in the future, but scientists have very few direct observations of the thermal conditions beneath the ice sheet, obtained through fewer than two dozen boreholes that have reached the bottom. Now, a new study synthesizes several methods to infer the Greenland Ice Sheet’s basal thermal state – whether the bottom of the ice is melted or not – leading to the first map that identifies frozen and thawed areas across the whole ice sheet.
“We’re ultimately interested in understanding how the ice sheet flows and how it will behave in the future,” said Joe MacGregor, a glaciologist at NASA’s Goddard Space Flight Center in Greenbelt, Maryland and lead author of the new study. “If the ice at its bottom is at the melting point temperature, or thawed, then there could be enough liquid water there for the ice to flow faster and affect how quickly it responds to climate change.”
For this study, published recently in the Journal of Geophysical Research: Earth Surface, a journal of the American Geophysical Union, MacGregor’s team combined four different approaches to investigate the basal thermal state. First, they examined results from eight recent computer models of the ice sheet, which predict bottom temperatures. Second, they studied the layers that compose the ice sheet itself, which are detected by radars onboard NASA’s Operation IceBridge aircraft and suggest where the bottom of the ice is melting rapidly. Third, they looked at where the ice surface speed measured by satellites exceeds its “speed limit,” the maximum velocity at which the ice could flow and still be frozen to the rock beneath it. Fourth, they studied imagery from the Moderate Resolution Imaging Spectroradiometers on the NASA Terra and Aqua satellites looking for rugged surface terrain that is usually indicative of ice sliding over a thawed bed.
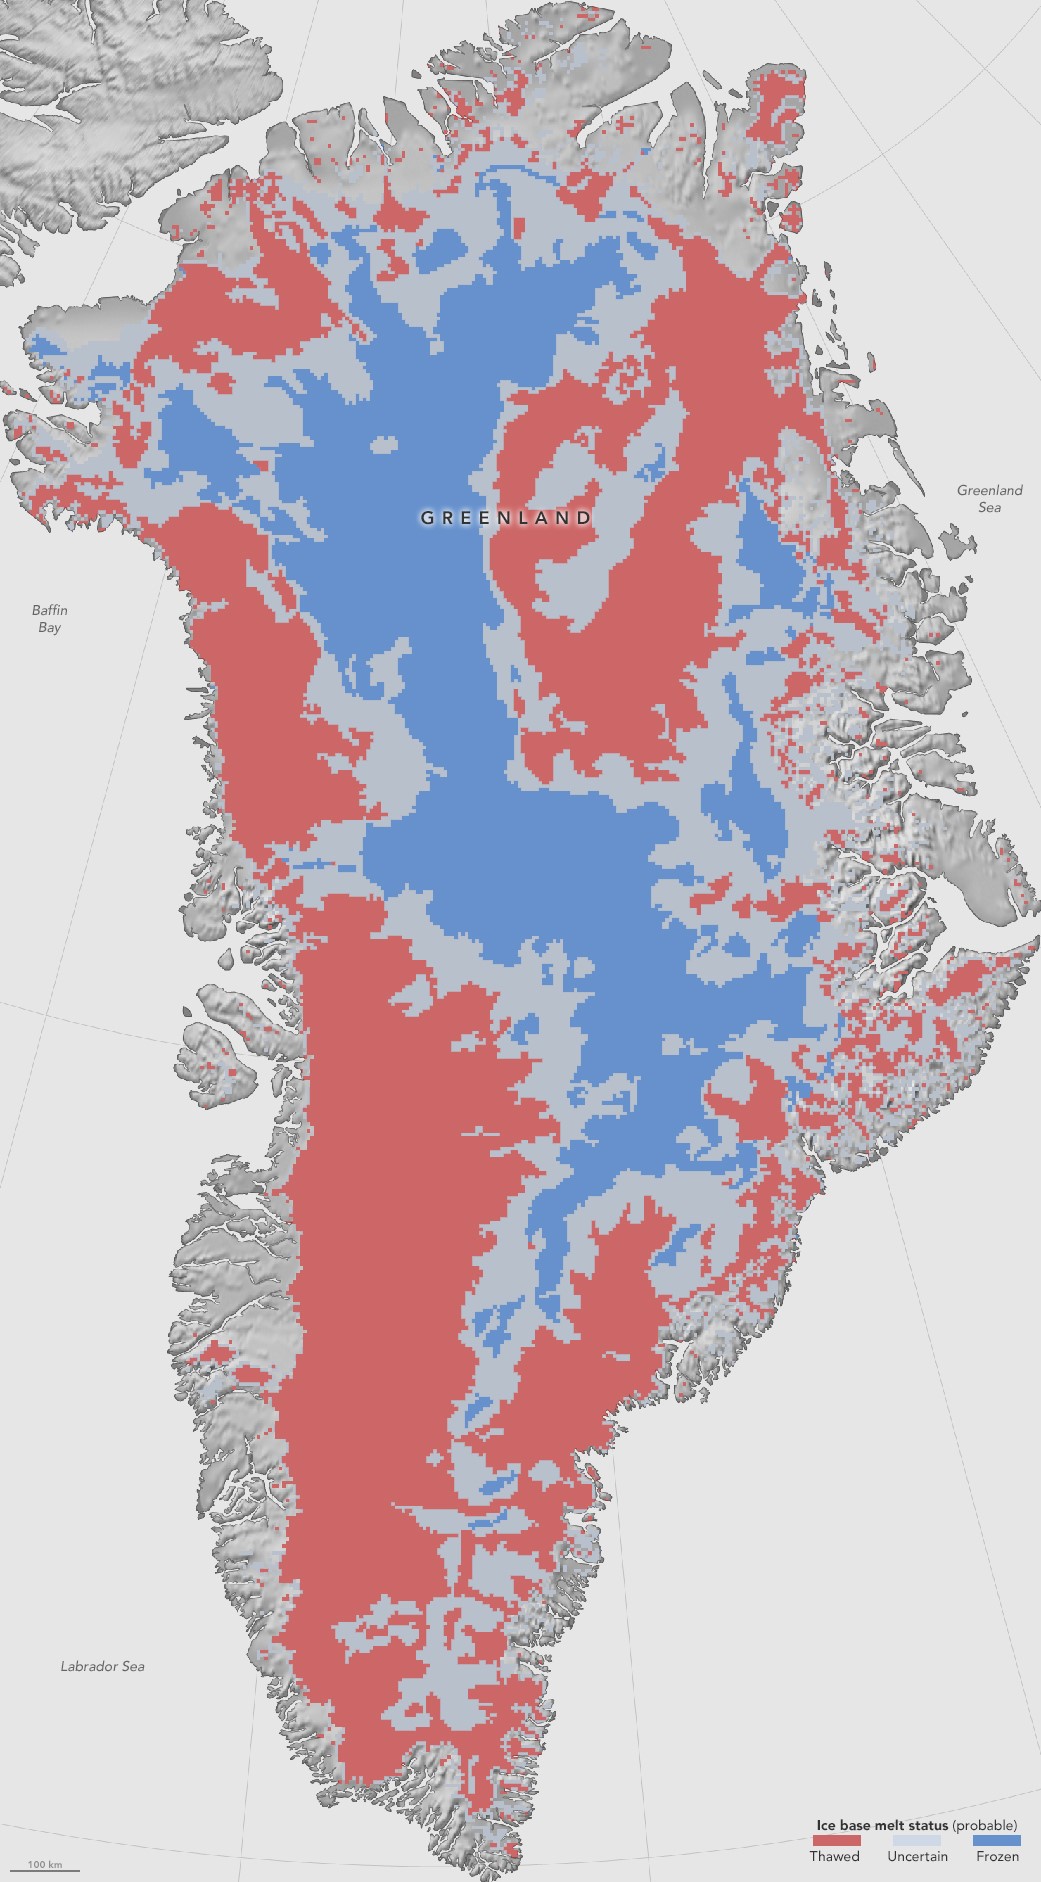
This first-of-a-kind map shows where the bottom of the Greenland Ice Sheet is likely thawed (red), frozen (blue), or uncertain (gray). Knowing whether Greenland’s ice lies on wet, slippery ground or is anchored to dry, frozen bedrock is essential for predicting how this ice will flow in the future.
Credit: NASA Earth Observatory map by Jesse Allen using data provided by NASA GSFC/Joe MacGregor.
“Each of these methods has strengths and weaknesses,” MacGregor said. “Considering just one isn’t enough. By combining them, we produced the first large-scale assessment of Greenland’s basal thermal state.”
For each method, MacGregor’s team looked for areas where the technique confidently inferred that the bed of Greenland’s ice sheet was thawed or frozen. They then looked at the places where these methods agreed and classified these areas as likely thawed or likely frozen. The zones where there was insufficient data or the methods disagreed, they classified as uncertain.
From this synthesis, MacGregor and his colleagues determined that the bed is likely thawed under Greenland’s southwestern and northeastern ice drainages, while it’s frozen in the interior and west of the ice sheet’s central ice divide. For a third of the Greenland ice sheet, there’s not enough data available to determine its basal thermal state.
MacGregor said the team’s map is just one step in fully assessing the thermal state of the bottom of Greenland’s ice sheet.
“I call this the piñata, because it’s a first assessment that is bound to get beat up by other groups as techniques improve or new data are introduced,” MacGregor said. “But that still makes our effort essential, because prior to our study, we had little to pick on.”
— Maria-José Viñas is a science writer for NASA’s Earth Science News Team. This post originally appeared as a feature story on the NASA website.