12 April 2016
Bringing the Seafloor into Focus
Posted by larryohanlon
The Lau Back-arc Basin is nestled between Tonga and Fiji, and adjacent to the Tonga Trench – where the Pacific Plate is being driven under the Australian Plate. This process, known as subduction, delivers oceanic crust, sediments and trapped water deep into the earth.
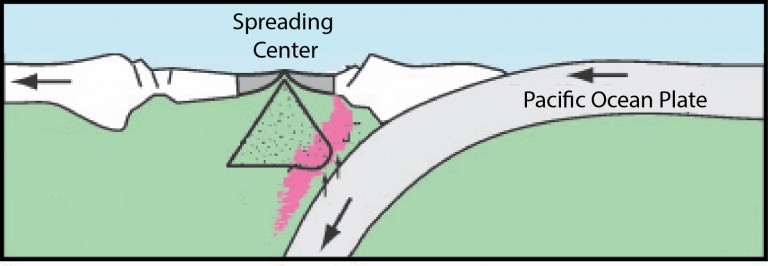
Schematic of the Lau Back-arc system showing the subduction zone and its influence on spreading centers. After Tivey et al., 2012
The hydrothermal vent fields we are studying on this cruise are located along spreading centers on the overriding plate. The relative proximity of the subduction zone to the spreading center has effects on the geology, geochemistry and ecosystems of the vent fields we are studying. The shape and characteristics of the seafloor itself are also affected.
Maps that describe the shape of the seafloor (also called “bathymetry”), are a fundamental component of our research during this cruise. These maps will provide geologic context for the ecosystems being studied, and will allow us to look for changes in the seafloor that may have occurred since the area was last mapped a decade ago. Changes, if they exist, could be due to volcanic or tectonic events that could not only reshape the seafloor but also dramatically affect the organisms living there.
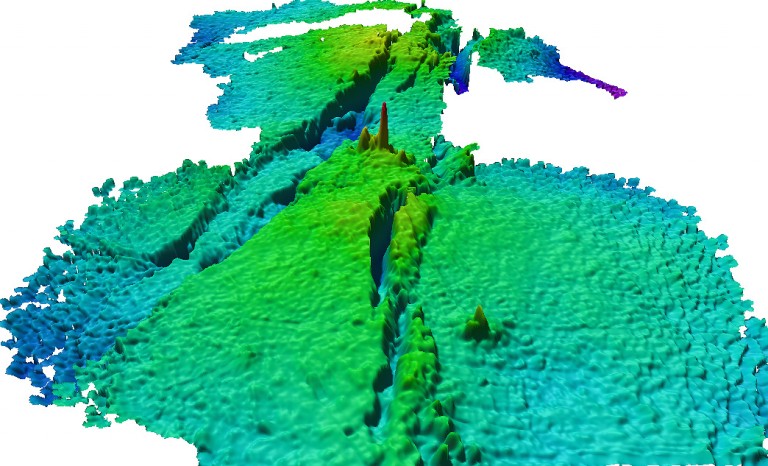
Bathymetry from the Kilo Moana vent field, mapped in 2005. Each grid cell in this image is 25 cm. Credit: SOI/Dr. V. Ferrini
While there are a variety of tools and techniques for mapping the seafloor, modern seafloor maps are typically gridded 3D surfaces that model the shape of the seafloor. These gridded surfaces are like a mesh draped over the seafloor. The size of individual squares of the mesh defines the level of detail we can see in the resulting 3D surface. Since sound travels efficiently in water, sonar is the most common and effective tool for measuring seafloor depth and creating these 3D surfaces. By transmitting a pulse of sound and measuring the time it takes for that sound to return to the sonar, we can compute depth.
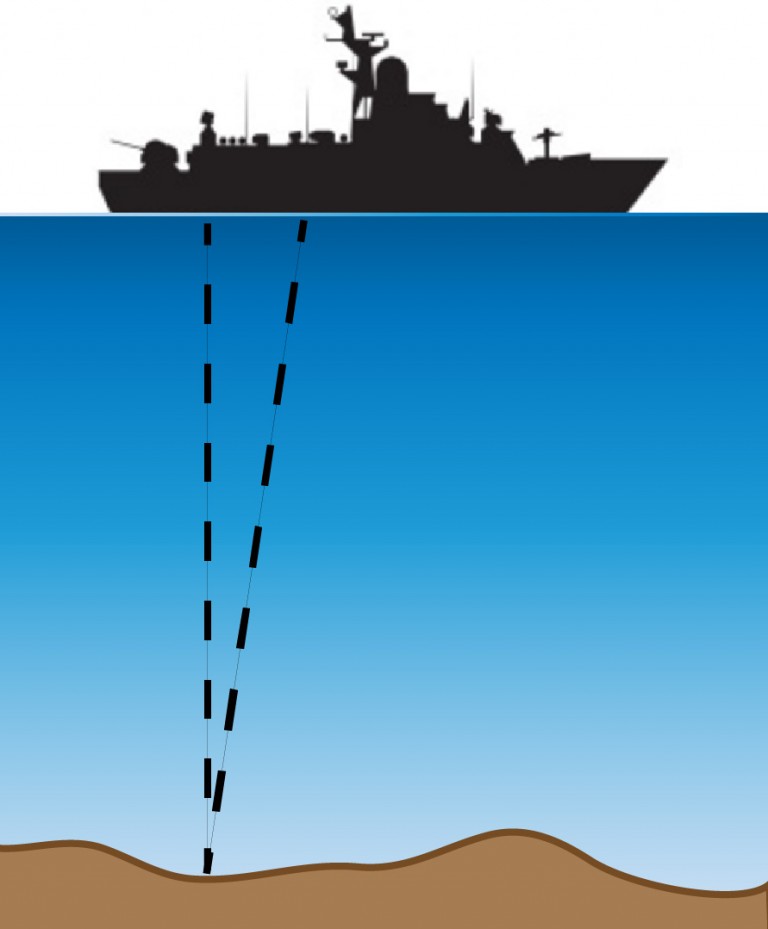
Schematic illustrating the basic concept of bathymetric mapping with sonar. A sound pulse is transmitted to the seafloor and bounces back at the ship. The total travel time is used to compute distance (depth). Credit: SOI/Dr. V. Ferrini
Now let’s think more carefully about the sound we are transmitting. Imagine you’re in a dark room with a flashlight in your hand and you’re shining the light on the wall. As you walk closer to the wall, the size of the area that’s lit up gets smaller, and the edges become sharper. Well, mapping with sonar works in much the same way – the sound beam behaves like the flashlight – as the sound source is moved closer to the target (seafloor), its footprint gets smaller. So it follows that if we can collect many measurements when the sonar is close to the seafloor, the resulting 3D surface can have a finer mesh, which will let us see more detail.
Our study sites are at water depths of 1,900-2,700 m, which is the equivalent of 4-6 Empire State Buildings stacked on top of each other. In this water depth, ship-based sonar systems could produce maps with a mesh size of about 100 m, or the length of 2 Olympic swimming pools. At this resolution we would not even see an airplane sitting on the seafloor. This is exactly why we have equipped the ROV with a high-resolution sonar system. By bringing the sonar closer to the seafloor, we can create very detailed maps, with mesh sizes of 1m (the size of a guitar) or smaller.
This means we can use our maps to see and measure details of individual hydrothermal vent structures as well as volcanic features like lava flows. Of course, increasing the resolution in this way means it will take longer to cover the area we’re interested in, but when we can make maps like the ones we made at these sites a decade ago, you can understand why we think it’s worth the time!
Dr. Vicki Ferrini is a Research Scientist at Columbia University’s Lamont-Doherty Earth Observatory. This post originally appeared on the Schmidt Ocean Institute blog.