19 March 2012
New northern sites update key temperature records
Posted by kramsayer

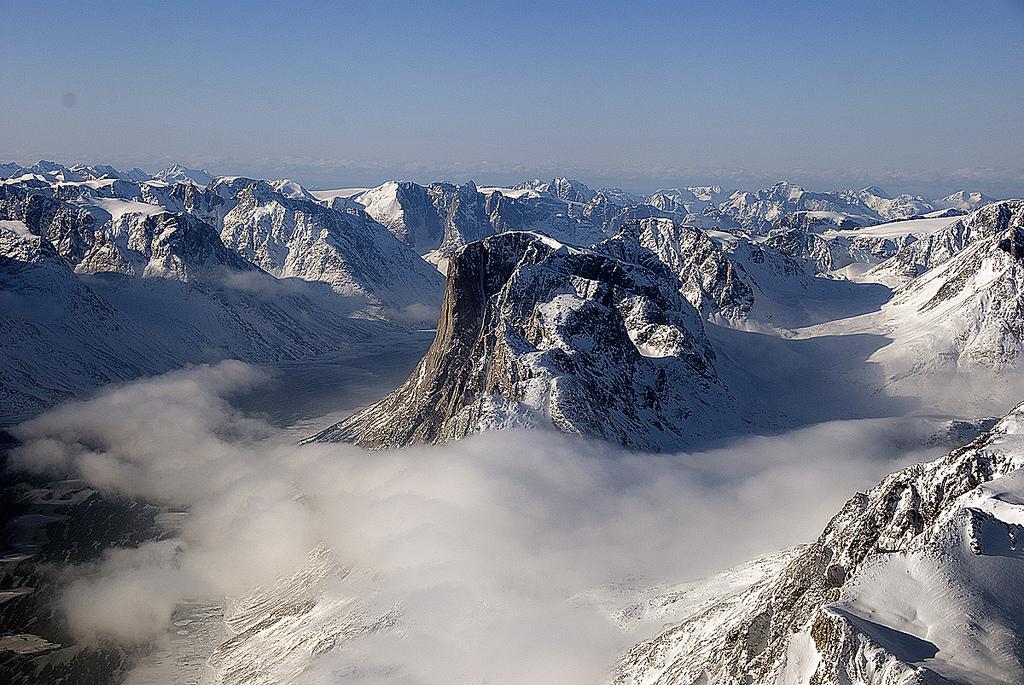
Updated with hundreds of additional sites, including some in Greenland, the HadCRUT4 dataset provides a more complete look at global temperature records. (Credit: NASA)
With information from more than 400 new sites, many from across the Arctic and other northern climes, scientists have now updated a key climate dataset. The new record also considers how sea surface temperatures measurements were taken decades ago, which often involved less-than precise techniques. And although the new information results in slight changes to the dataset’s record of global mean temperature for some years, it still shows the same overall trend: warming of about 0.75 degrees Celsius (1.35 degrees Fahrenheit) since 1850.
One of the drawbacks of the previous dataset, called HadCRUT3, was that it didn’t fully capture what was going on in the Arctic region, which is warming faster than other areas, said Phil Jones, director of the Climatic Research Unit at the University of East Anglia, and an author of recent papers detailing the dataset updates. With the addition of temperature records from hundreds of new sites from northern Canada and Russia, it “has led to better representation of what’s going on in the large geographical region,” Jones said.
The new HadCRUT4 dataset also includes new temperature data from stations in Greenland, the Faroes, Denmark, the Alps, and other areas. A report on the new records will be published in the Journal of Geophysical Research-Atmospheres, a journal of the American Geophysical Union.
The dataset includes new measurements of sea-surface temperatures, and a new method of accounting for how these temperatures were taken throughout the span of the record. In the 19th and early 20th centuries, sea-surface temperatures were frequently taken by hauling up buckets of water onto a ship’s deck – which would typically cool the water down, said Colin Morice, climate monitoring research scientist at the United Kingdom’s Met Office and lead author of the study. In the 20th century, water temperatures were increasingly taken in the engine room, although the warmth of the ship’s interior can cause a bias as well.
“We’ve scientifically quantified these effects,” Morice said, “enabling us to gain a clearer picture of temperature development over the past 161 years.”
![]()
Morice, C., Kennedy, J., Rayner, N., & Jones, P. (2012). Quantifying uncertainties in global and regional temperature change using an ensemble of observational estimates: The HadCRUT4 dataset Journal of Geophysical Research DOI: 10.1029/2011JD017187
– Kate Ramsayer, AGU science writer


 GeoSpace is a blog on Earth and space science, managed by AGU’s Public Information staff. The blog features posts by AGU writers and guest contributors on all sorts of relevant science topics, but with a focus on new research and geo and space sciences-related stories that are currently in the news.