December 28, 2016
Canadian Columbia Basin Glacier Fall 2016 Field Season
Posted by Mauri Pelto
Guest Post by Ben Pelto, PhD Candidate, UNBC Geography, [email protected]
Figure 1. An illustration of the glacier mass balance sum. Mass balance is equal to the amount of snow accumulation and the amount of ice melt over time. Traditionally, this is reported as annual mass balance (how much mass a glacier gained or lost in a particular year) and is reported in meters water equivalent (mwe).
The Columbia Basin Glacier Project is studying the mass balance of several glaciers in western Canada to assess their ‘health’ over time (Figure 1) using field-based measurements and remote sensing. This work is funded by the Columbia Basin Trust and BC Hydro. During the fall season of 2016, we visited our four study glaciers in the Columbia Mountains (Figure 2). These form a transect from south to north: the Kokanee Glacier (in the Selkirk Range), Conrad Glacier (Purcell Range), Nordic Glacier (Selkirk Range), and Zillmer Glacier (Premier Range). We also visited Castle Creek Glacier and the Illecillewaet Glacier with Parks Canada. This post is an overview of the field season and some preliminary results for 2016.
If you are interested in our main research objectives and methods, you can see the abstract from my recent talk at the American Geophysical Union conference and a video of an accompanying press conference (my piece starts at 18 minutes) with Gerard Roe (University of Washington) and Summer Rupper (University of Utah) titled: Attributing mountain glacier retreat to climate change. More information can be found in the November 29th episode of the Kootenay Co-op radio program Climate of Change (start at 34 minutes).

Figure 2. Map of the Columbia River Basin in Canada. Our six study glaciers are marked by red stars. Other glaciers are in light blue (from the Randolph Glacier Inventory) and major rivers and lakes are in dark blue.
Our research consists of both field work and remote sensing. The fieldwork involves manually measuring the amount of snow that accumulates and ice that melts on each glacier at the start (spring) and end (fall) of each melt season (Figure 3). This gives us a mass balance measurement for individual glaciers but is very labor intensive (even if the views are great!). The remote sensing portion of the project is conducted using aerial laser altimetry (Figure 4). To conduct the laser altimetry we mount a Light Detection and Ranging (LiDAR) unit to the bottom of a fixed-wing aircraft and fly surveys of the glaciers twice each year. This creates two 3-Dimensional models of each glacier, one for the spring and one for the fall. When we subtract the spring model from the fall model, we are left with the thickness change of the glacier, and can thus derive mass change. We are still developing this method as a means of measuring more glaciers each year than could be achieved in the field.
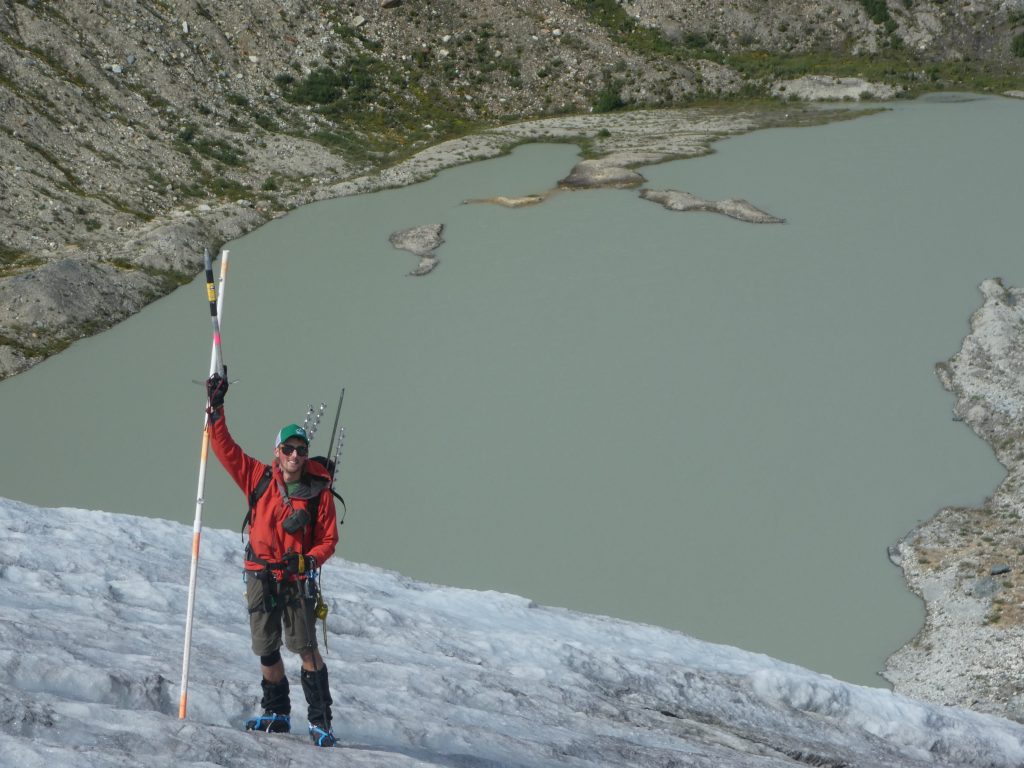
Figure 3. To measure ablation (ice melt) we use ablation stakes drilled into the glacier in fall so that the top is flush with the ice surface. The following year, we visit the stakes to measure how much ablation has occurred during the summer, and then drill them in again to record the next year’s melt. In fall 2015, the top of this stake in the terminus of Nordic Glacier was flush with the ice surface, so it has lost nearly 3 meters of ice thickness (photo by Micah May). 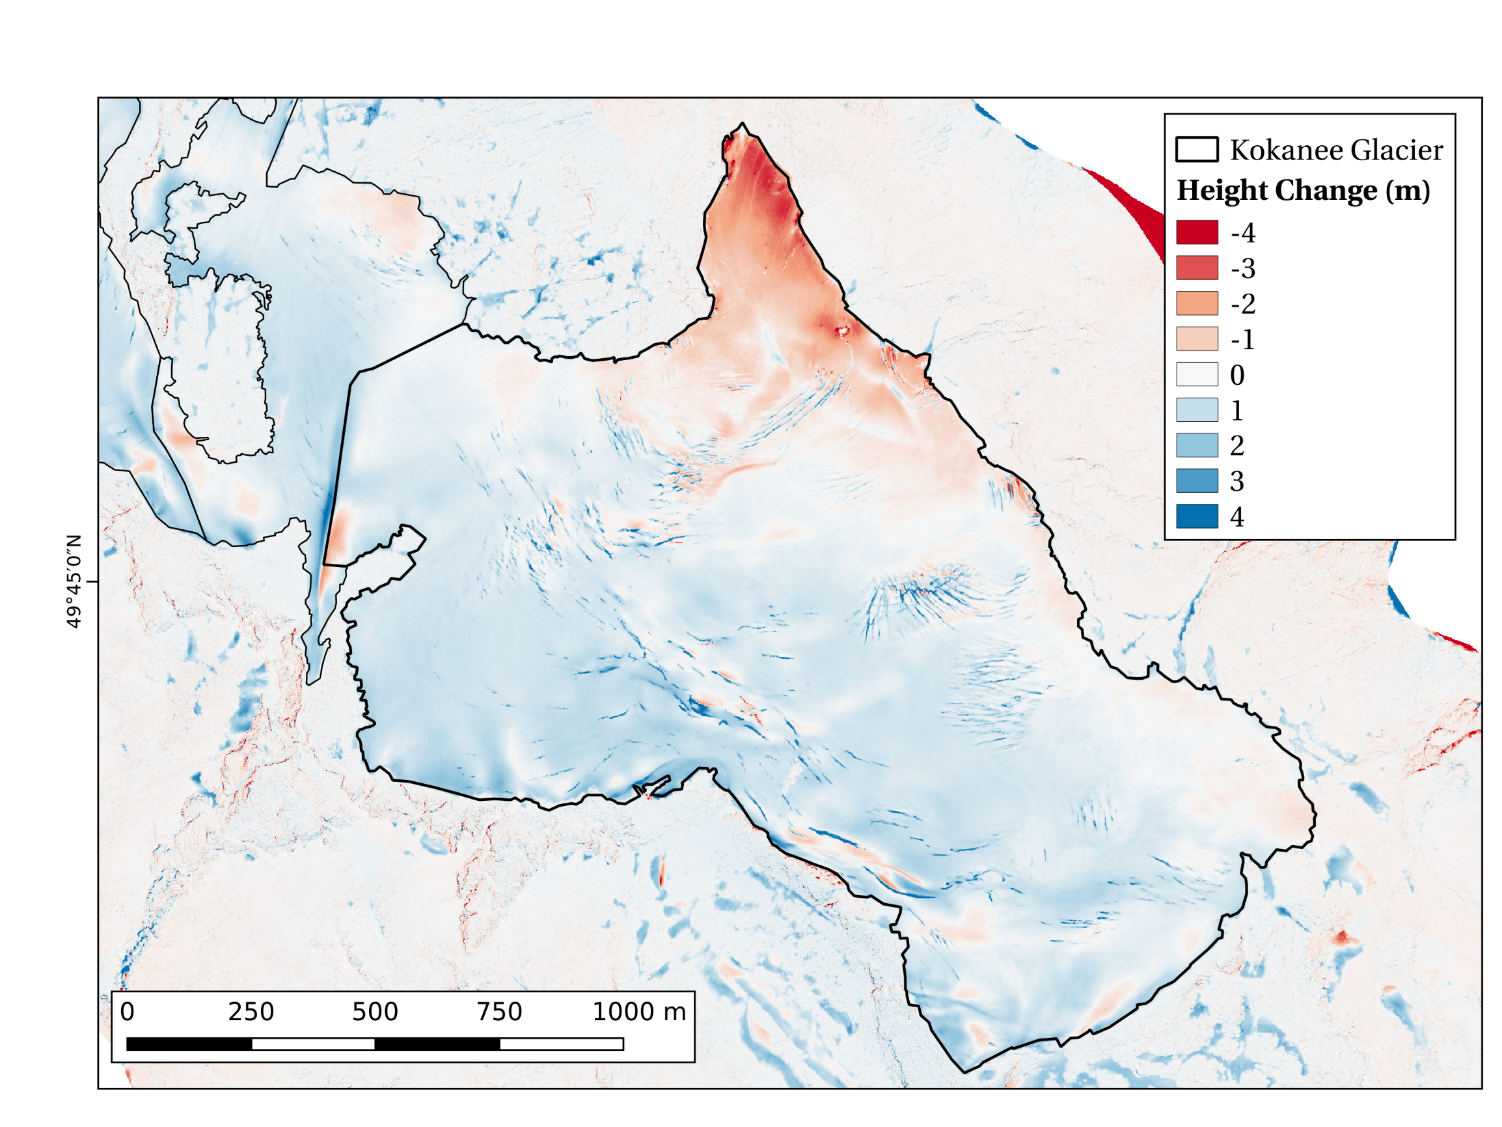
Figure 4. Kokanee Glacier elevation change map showing the difference in glacier elevation between September 2015 and September 2016. The difference can be used to calculate glacier mass loss. The glacier (black outline) flows from the bottom of the page to the top, so the terminus of the glacier lost the most mass whereas the middle reaches are net neutral and the upper reaches gained mass. Non-ice areas (e.g. rock) are white because there was no elevation change. The blue and red patches outside the glacier are changes in seasonal snow patches and fresh snow deposited in depressions after a small storm at the time of the 2016 survey.
The year of 2015 was a record for glacier melt across western North America. By contrast, 2016 resulted in slightly negative mass balance for our study glaciers. This means that on average the glaciers we studied lost far less mass in 2016 than in 2015 (and 2014, see Figure 5).
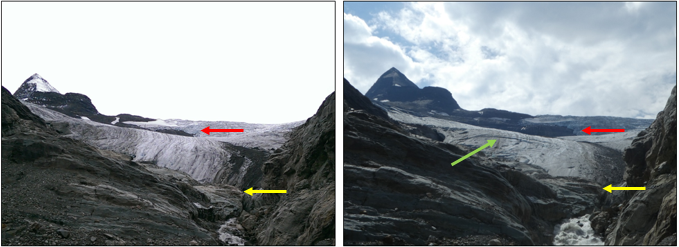
Figure 5. The Conrad Glacier terminus in 2014 (on the left) and 2016 (on the right). Between 2014 and 2016, the terminus of this glacier retreated by 75 m (yellow arrows) and the glacier also thinned markedly. The visibility of the rock band in the center of the image shows this thinning of the ice (red arrows). Also note the orbital crevasses (green arrow), which formed due to the collapse of ice caves along the margin. These ice caves formed in 2014 and 2015 as the surrounding exposed rock warmed (via solar heating) and melted the ice margins from below, and subsequently collapsed in 2016.
Spring arrived around four weeks earlier than normal this year, as we noted in our spring report, with the melt season commencing near the start of April instead of the start of May. At the beginning of April, the 2015-2016 winter had resulted in average snowpack in the northern half of the Columbia Basin and above-average snowpack in the southern half. However, early hot temperatures during April then led to early melt instead of a slow increase in snow throughout the rest of the spring. By mid-April, the snowpack across the entire basin had dropped to under 50% of the normal amount. One caveat here is that province-wide snow monitoring includes many measurements at around 2000 m, but very few above this elevation. Most glaciers in the Columbia Basin lie above 2000 m elevation, so our understanding of the snowpack affecting these glaciers is limited. While there are no long term records for higher elevations in the basin, our data, and discussions with local ski guides and lodge operators, suggests that the snowpack was probably around average during winter 2015-2016 until April.
Our measurements indicate that overall, the 2015-2016 winter resulted in a snowpack that was only 7% lower than the 2014-2015 winter. Why, then, was 2015 a year of substantial mass loss in the Columbia Basin but 2016 only a slightly negative year? The answer is that temperature difference has a far greater impact in this region than the amount of snow accumulation. In our region, at the elevation where glaciers are located (generally above 2000 m), the variability in snowfall year to year is far smaller than the variability in annual temperatures. Temperatures have risen over the Canadian portion of the Columbia River Basin by 1.5°C over the past century, more than double the global rate according to the Columbia Basin Trust. Due to rising temperatures, above-average snowpack is needed just to break even in a typical year. Thus, in order to have a positive mass balance year, you need above average snowfall and below average temperatures.
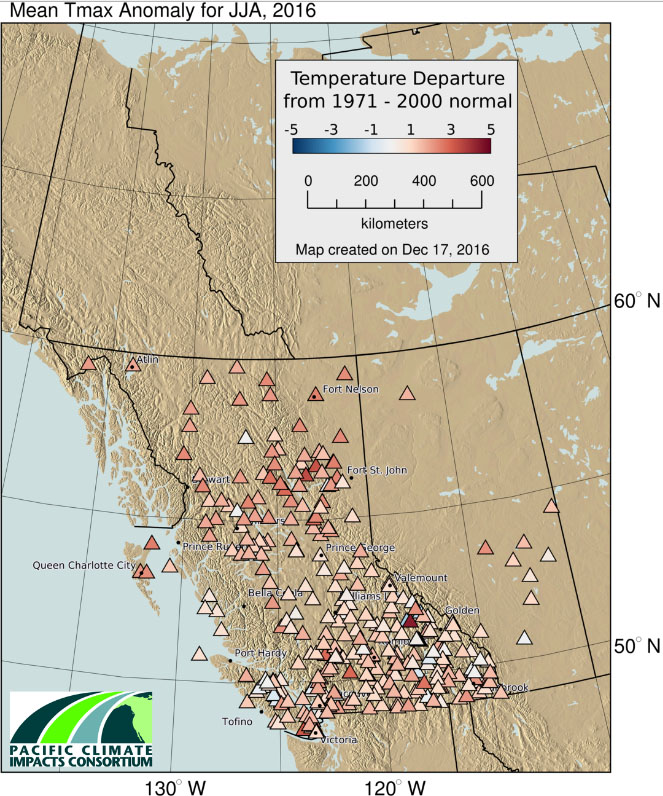
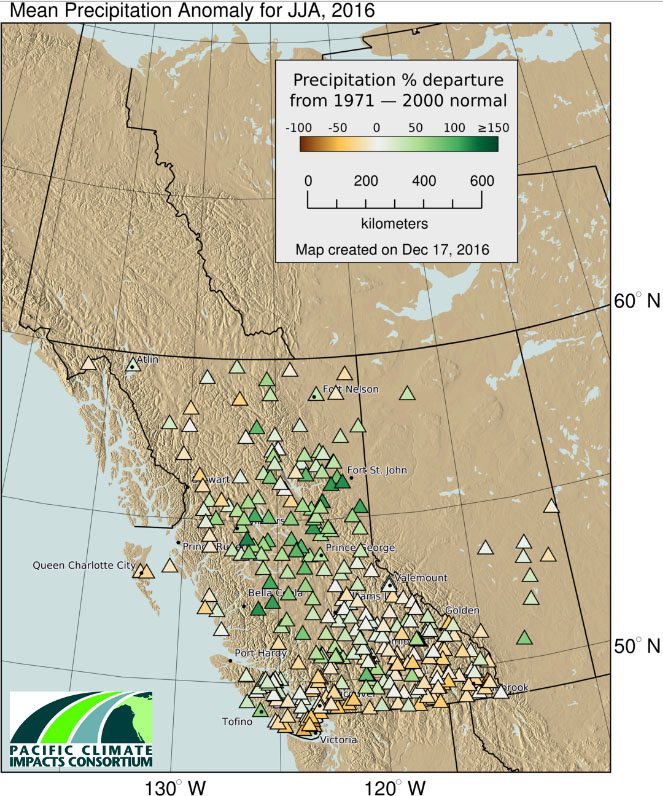
The summer of 2016 featured average to slightly above average temperatures (Figure 6), with a cooler-than-average July. This is in contrast to the last two years, which both featured well-above-average temperatures through the melt season. Precipitation was also about average over the basin during the summer months (Figure 7). The basin began with a roughly average alpine winter snowpack, experienced an early and hot spring, slightly warmer-than-average summer temperatures, and average precipitation. The combination of these factors led to a slightly negative mass balance overall for our glaciers in 2016: those in the north lost around 0.5 mwe and those in the south stayed around neutral or even slightly gained mass.
Figure 6. Summer (June/July/August) mean daily maximum temperature anomaly for British Columbia in 2016. The red ellipse highlights the Columbia Basin, where temperatures were average to slightly above average (data from the Pacific Climate Impacts Consortium).
The 2016 trend was likely due, in part, to the prevailing position of the jet stream in the 2015-2016 winter. The northerly position of the jet stream, and persistent ridge over the Pacific Northwest, led to warmer winter temperatures over the southern part of the Columbia Basin but also more moisture and concentrated storm tracks (calcification: while accumulation variability resulting from winter weather patterns may have played a role in the north-south trend, the magnitude of mass change (small loss) was controlled by melt season temperatures). My favorite location to observe the jet stream in winter is from the California Region Weather Server at San Francisco State University. There have been many discussions of the jet stream behavior and its influence on winter weather in this region (here’s a simple overview from NOAA). The north-south trend was observed in 2015 as well, but in reverse, with the glaciers in the south experiencing greater mass loss.
Figure 7. Summer (June/July/August) precipitation anomaly for BC. Red ellipse highlights the Columbia Basin. Columbia Basin precipitation was net average to slightly below average for summer 2016 (Pacific Climate Impacts Consortium).
Well-above-average snowfall and well-below-average spring, summer and fall temperatures would be needed for any of the Columbia Basin glaciers to gain substantial mass. This has happened just twice over the past 20 years, as recorded by the North Cascades Glacier Climate Program in the North Cascades of Washington, just southwest of the Columbia Basin. During the winter of 1999, Mt. Baker set the record for most snowfall ever recorded in the US at 1140 inches (or 2900 cm, yes…29 meters!), leading to average glacier mass gain of over 1 meter water equivalent (mwe). The winter of 2011 also featured above average snowpack, and in combination with a cool and cloudy summer, led to below-average melt and a positive mass gain of over 1 mwe. Unfortunately, closer to the Columbia Basin, the Peyto, Place and Helm Glaciers of British Columbia, have never reported a mass gain of 1 mwe since Geologic Survey of Canada records began for those glaciers in the 1960s and 1970s.
The take home points:
- In 2016, glaciers in the Columbia Basin experienced a slightly negative mass balance year. There was slight mass gain in the south (less than +0.25 mwe) and moderate mass loss in the north (around -0.5 mwe).
- At present, an average year still results in moderate glacier mass loss in the Columbia Basin. Either above-average snowpack or below-average temperatures are needed during the melt season for a neutral mass change. A combination of both is required for the glaciers to gain mass.
If you want to see what our fieldwork looks like in practice, see my video from the spring field season.


 Dean of Academic Affairs at Nichols College and Professor of Environmental Science at Nichols College in Massachusetts since 1989. Glaciologist directing the North Cascade Glacier Climate Project since 1984. This project monitors the mass balance and behavior of more glaciers than any other in North America.