
October 28, 2016
Coley Glacier Retreat, James Ross Island, Antarctica
Posted by Mauri Pelto
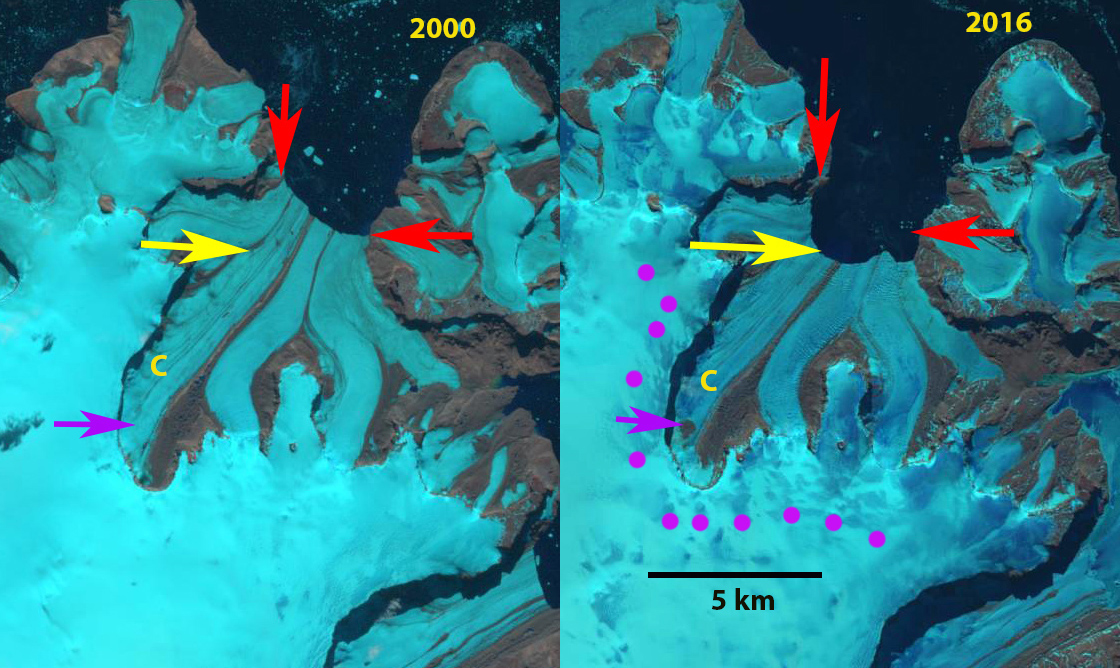
Coley Glacier terminus comparsion in Landsat images from 2000 (red arrows) and 2016 (yellow arrow) indicating a retreat of 2 km along the western side and 1 km along the eastern side. Purple dots indicate the transient snowline and the purple arrow an area of debris exposed with glacier thinning.
Coley Glacier is a tidewater glacier on the northeast side of James Ross Island near the tip of the Antarctic Peninsula. Davies et al (2012) observed that 90% of the glaciers of the Northern Antarctic Peninsula including James Ross Island retreated from 1988-2001 and 79% from 2001-2009. They further observed that the rapid shrinkage of tidewater glaciers on James Ross Island would continue due to their low elevation and relatively flat profiles. Rohss Bay Glacier is one example of this having retreated 15 km from 1999-2009 (Glasser et al, 2011). Barrand et al (2013) note a strong positive and significant trend in melt conditions in the region, driving the retreat.
Coley Glacier in 2000 had a relatively straight calving front running across the embayment. The front represents the joining of four tributary glaciers. The snowline was generally below the top of the escarpment just west of Point C, the elevation of this lower glacier reach is below 200 m. This fits the low elevation low slope criteria noted by Davies et al (2012). By 2016 the glacier has developed a concave glacier front with the northern tributary almost separating the retreat ranges from 2 km on the west side to 1 km on the east side. The snowline is above the escarpment at 400 m. A comparison below of 2001 and 2015 indicates that the snowline in 2015 was also near 400 m and above the escarpment. A map of the region from the USGS (Ferigno et al.,2006) illustrates the retreat from the 1960’s to 2000. Nývlt et al (2010) reported on the retreat and changes on two glaciers on the north side of James Ross Island.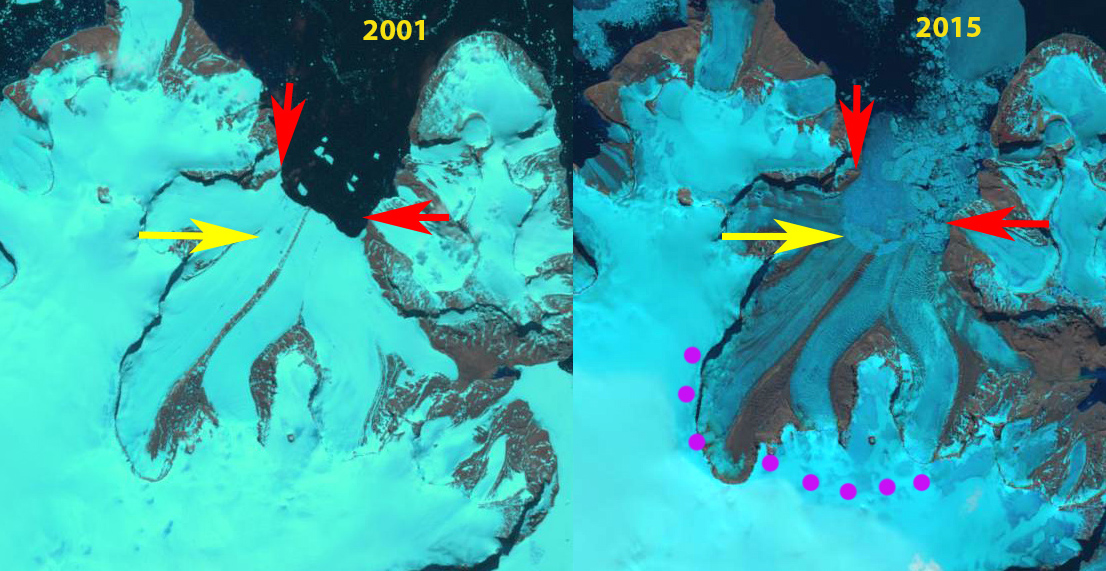
Coley Glacier terminus comparison in Landsat images from 2001 and 2015. Red arrows is the 2000 terminus and yellow arrows the 2016 terminus. Purple dots indicate the transient snowline and the purple arrow an area of debris exposed with glacier thinning.

COASTAL-CHANGE AND GLACIOLOGICAL MAP OF THE TRINITY PENINSULA AREA AND SOUTH SHETLAND ISLANDS, ANTARCTICA: 1843–2001
USGS (Ferigno et al.,2006)
 Dean of Academic Affairs at Nichols College and Professor of Environmental Science at Nichols College in Massachusetts since 1989. Glaciologist directing the North Cascade Glacier Climate Project since 1984. This project monitors the mass balance and behavior of more glaciers than any other in North America.