
July 7, 2016
Lamplugh Glacier Recent Behavior and Landslide Source Area, Alaska
Posted by Mauri Pelto

Lamplugh Glacier before and after landslide, in Landsat 8 images, which is 7.5 km long and covers 17 square kilometers. L=Lamplugh, R=Reid and B=Brady Glacier.
A recent large landslide onto Lamplight Glacier on June 28, 2016 has been reported by KHNS. The landslide was triggered on the north slope of a steep unnamed mountainside on the west side of the Lamplugh Glacier, Glacier Bay, Alaska. The landslide has been estimated at 120 million tons by Colin Stark from Lamont Doherty . The region has been experiencing substantial retreat and glacier thinning such as on Brady Glacier, McBride Glacier. and Muir Glacier Loso et al (2014). However retreat on Lamplugh Glacier has been minimal since 1985, with USGS photographs from 1941 and 2003 indicating a 0.5 km advance. The glacier terminus in the last decade has thinned, narrowed and begun a slow limited retreat.The thinning of the glacier has been mapped by University of Alaska Fairbanks aerial flights since 1995 (Johsnon et al, 2013). They found from 1995 to 2011 that Lamplugh Glacier lost the least ice thickness per year compared to neighbors Ried and Brady Glacier, at -0.32 m/year, Ried at -0.5 m/year and Brady Glacier at -1.4 m/year Loso et al (2014). Because the glacier has been receding less than the neighbors it is not a natural choice for a retreat/thinning driven landslide. The snowline that is shared with Brady Glacier has risen 150 m during the 2003-2015 period (Pelto et al, 2013). This indicates increased melting at higher elevations. The greater melting on the north face of the failed slope could be a factor in the landslide. Southeast Alaska had its warmest spring ever this year, which is leading to higher area snowlines for this time of year on glaciers as noted at this blog three weeks ago on Brady Glacier. The North American Freezing Level Tracker notes an average freezing line 35 m above the mean for 1948-2015 and the highest on record in 2016 averaging nearly 1300 m.
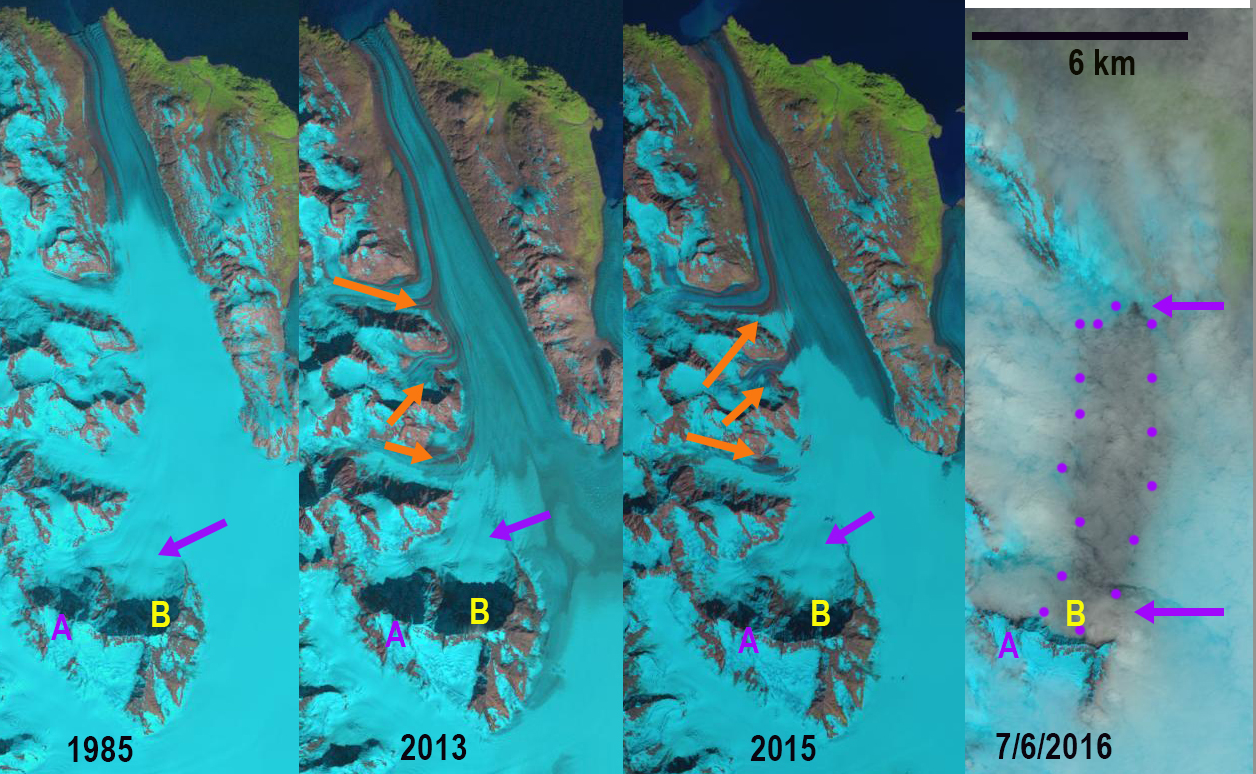
Landsat image comparison of Lamplugh Glacier 1985, 2013, 2015 and 2016. The orange arrows indicate extensive surface moraine deposits. purple arrows the region below the slope where landslide was triggered. Point B trigger location and Point A a nearby cloud free location in each image.
A comparison of Landsat images indicates the trigger location Point B, with Point A being a location that is not cloud covered in any image for reference. The landslide through thin clouds is marked by purple arrows and purple dots on the July 6, 2016 image. The landslide extends approximately 9 km down glacier from the trigger site. Orange arrows indicate locations of extensive medial moraines due to erosion and possibly previous landslides. It is apparent that these areas stem from he west side of the glacier lower on the glacier than the current landslide trigger area. This area has not been the source of significant surface debris in the last 30+ years. Pelto et al (2013) noted that the snowline on neighboring Brady Glacier has risen by 150 m, this is the most pronounced impact of climate change to date for Lamplugh Glacier. The rising rate of landslides has been tied to increase melt in the Swiss Alps as permafrost on rock faces thaws. This post will be updated when clear Landsat imagery is available.
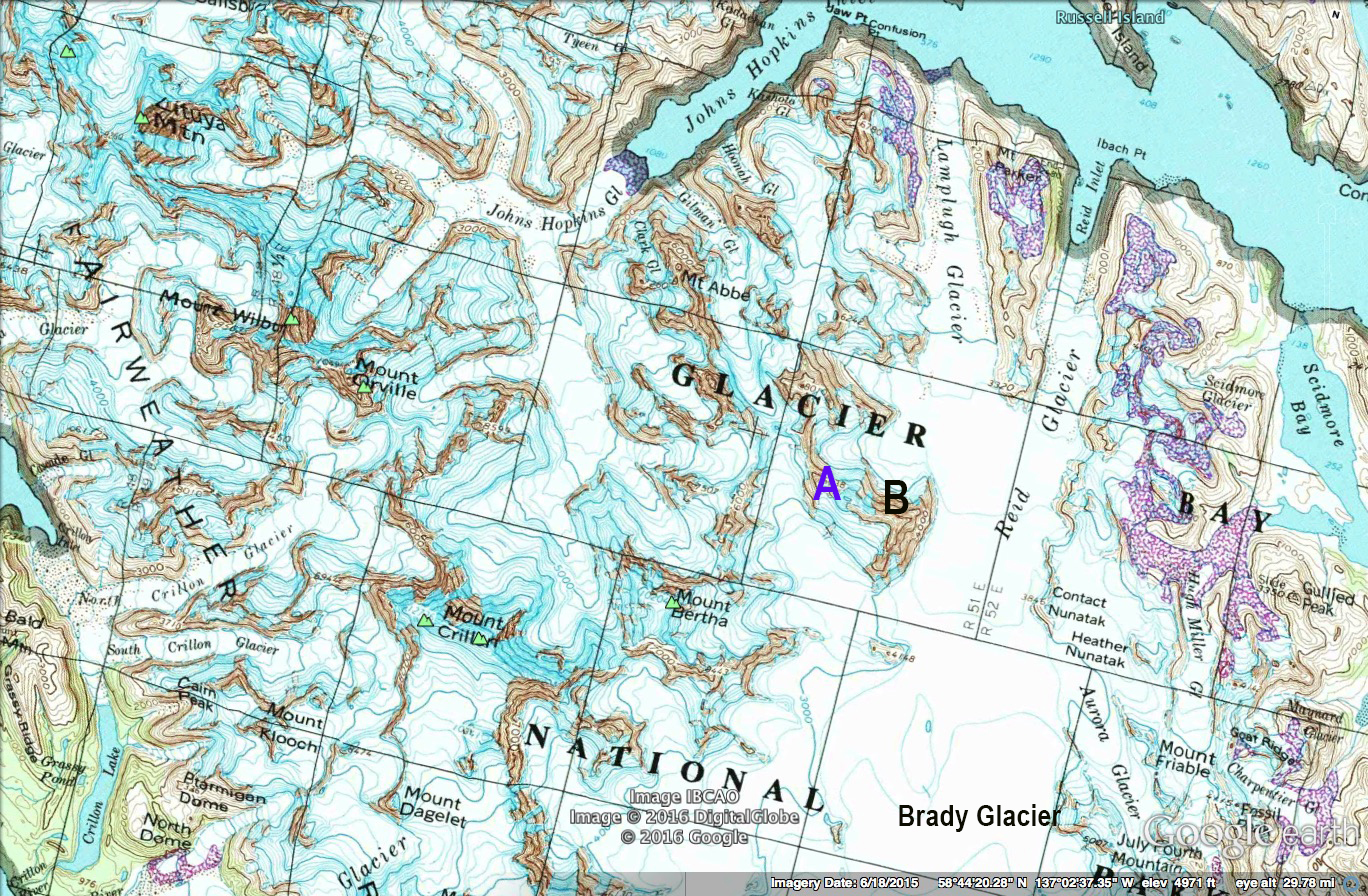
USGS Topographic map of the region overlay in Google Earth. Point B is the trigger point.
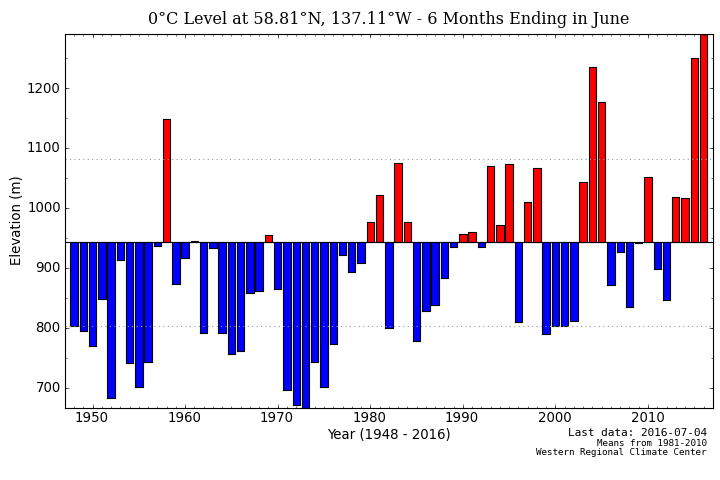
Freezing Level Tracker for Glacier Bay, AK
 Dean of Academic Affairs at Nichols College and Professor of Environmental Science at Nichols College in Massachusetts since 1989. Glaciologist directing the North Cascade Glacier Climate Project since 1984. This project monitors the mass balance and behavior of more glaciers than any other in North America.