
December 30, 2015
Orpissuup Tasia Glacier slowdown, SW Greenland
Posted by Mauri Pelto
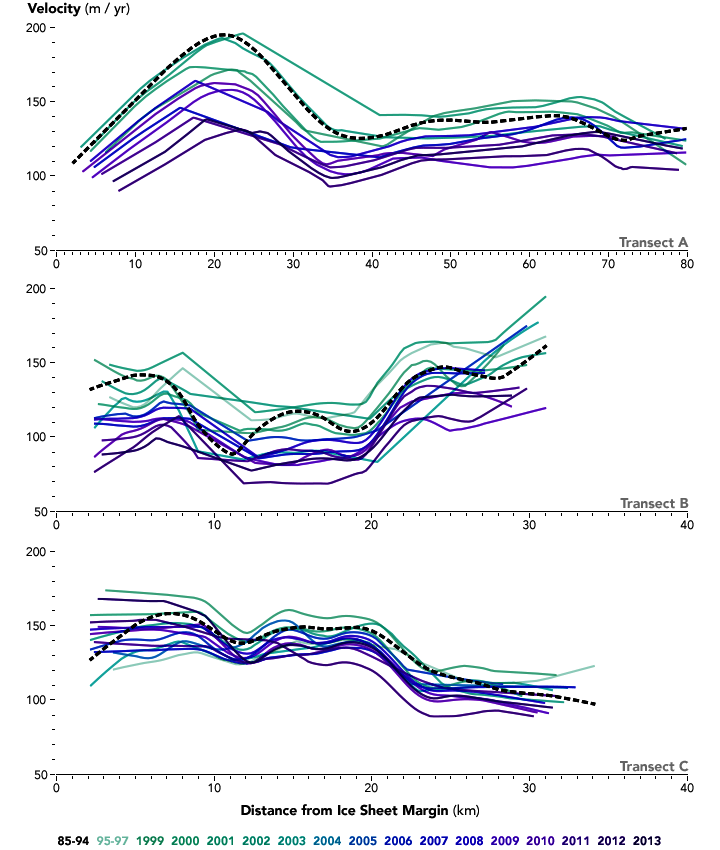
Tedstone et al (2015) Figure 3 illustrates the widespread velocity decline along three transects.
Pelto et al (1989) after a field campaign we mounted in 1985 and 1986 on Jakobshavns Glacier noted that the velocity was essentially the same in the summer of 1964, 1976, 1978, 1985 and 1986. Further we observed that the agreement between surface mass-balance and volume-flux calculations, suggested that “Jakobshavns Isbrae: is almost in a state of equilibrium”. The point of the study was to establish a baseline of velocity before the anticipated acceleration due to warming. This acceleration due to warming happened beginning in 1992 from 20 m/day at the calving front in 1985 to 46 m/day in 2012, comparing the same locations the annual speed increase was 282% from 1992 to 2012 (Joughin et al 2014). The Jakobshavns Isbrae is a tidewater glacier, just south of the glacier the margin of the ice sheet is dominated by a land terminating section that has a different dynamic response to warming.
Tedstone et al (2015) in a paper published in Nature in October noted a decadal reduction in glacier velocity for a land terminating region of the Greenland Ice Sheet. This slow down occurred despite a 50% increase in meltwater production. This is emphasized in the figure above indicating the changes along three transects from green earlier to purple later years. A glacier inhabits a particular topographic environment that establishes the basic flow field. Climate change can affect glacier flow by increasing ice melt, which leads to ice thinning and a consequent reduction in force generating ice deformation and flow. This same ice melt can deliver meltwater to the base of the ice sheet, which can lead to short term increases in basal water pressure that will drive acceleration, the acceleration tends to be short lived. The overall impact of these competing forces is what this study indicates, that just as is the case on alpine glaciers thinning resulting from more melt leads to velocity reductions as a more efficient hydrologic system develops reducing basal water pressure. This same process clearly does not apply to calving tidewater outlet glaciers. Here we examine the changes at the terminus, evidence of thinning and location of moulins on the outlet glacier that flows into a series of lakes, Orpuussit Tasia, along Transect B.
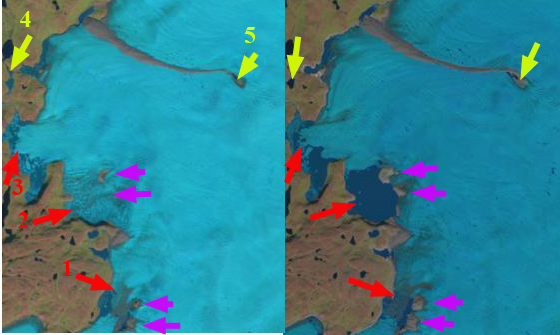
Landsat image comparison from 2000 and 2015.
In the comparison of Landsat images above from 2000 and 2015 the expansion of small proglacial lakes is evident at each red arrow, #2 has the greatest expansion. At the yellow arrows thinning is evident at a small lake that is fed by glacier runoff giving it a green sediment laden color, and by 2015 no longer receives meltwater as the ice sheet has thinned below the watershed divide, yielding clearer water which appears darker. The expansion of the end of the medial moraine also indicates thinning. Four bedrock areas emerging from the ice have much greater prominence in 2015 than 2000 purple arrows. This is modest thinning and retreat compared to the Jakobshavn and other large outlet glaciers to the north. The first image below indicates the terminus with red dots in a Google Earth image. The terminus as the proglacial lake #2 is pinned on a two bedrock prominences which should slow retreat. Proglacial lake #3 does not have an evident pinning point, and should retreat back towards the peninsula to the south in the near future. The second image below indicates the supraglacial streams and moulins in a small area of this glacier. The linear nature of many streams indicate they are occupying former crevasse features. Just as in the 1980’s little of the runoff reaches the terminus at the surface, almost all is directed to the base via moulins. Tedstone et al (2015) found that velocity did increase in summer, but declined more in the winter. NASA Landsat and Nasa Earth Observatory provides several excellent figures and explanation of the process in the study area.
.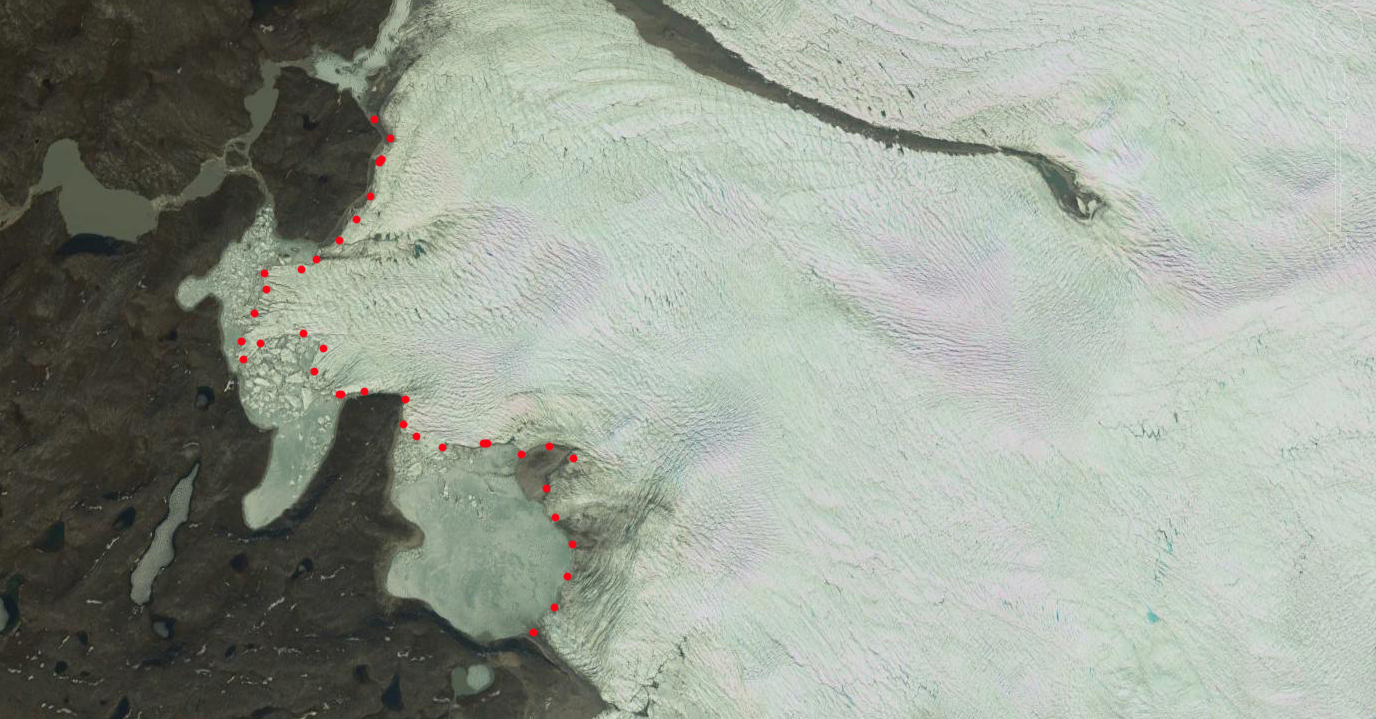
Google Earth image indicating ice sheet margin in 2012, red dots.
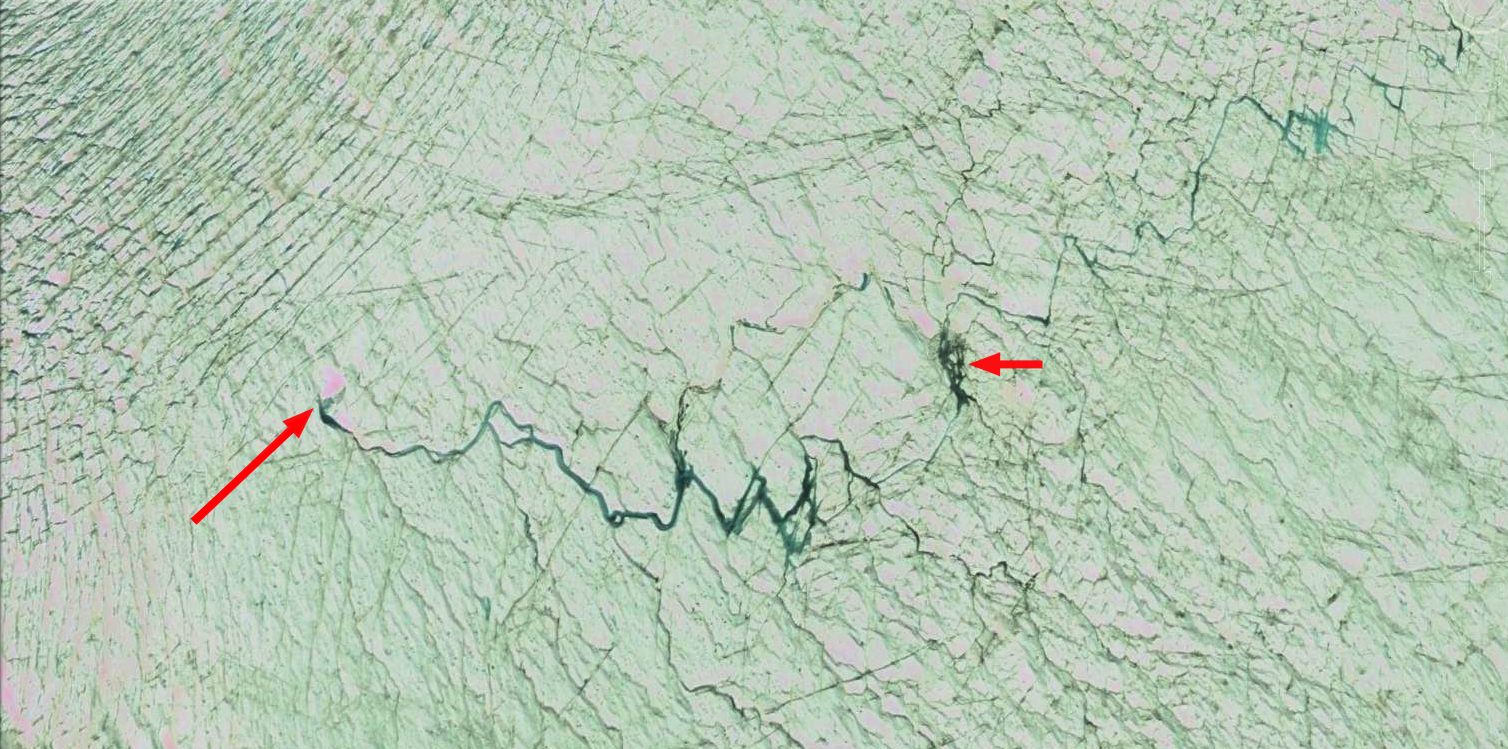
Google Earth image indicating surface streams and locations of two moulins.
 Dean of Academic Affairs at Nichols College and Professor of Environmental Science at Nichols College in Massachusetts since 1989. Glaciologist directing the North Cascade Glacier Climate Project since 1984. This project monitors the mass balance and behavior of more glaciers than any other in North America.