
February 20, 2014
Pacific Northwest Glacier Mass Balance 2013
Posted by Mauri Pelto
North Cascades Climate Conditions:
The 2013 winter accumulation season featured 93% of mean (1984-2013) winter snow accumulation at the long term USDA Snotel stations in the North Cascades, Washington (Figure 1). The melt season was exceptional by several measures. The mean summer temperature from June-September and July-September at Lyman Lake is tied with the highest for the 1989-2013 period (Figure 2). The average minimum temperature at Lyman Lake was the highest since 1989 for the July-September period, and tied with the highest for the June-September period (Figure 3). SeaTac airport minimums were high as well indicating the regional nature.
-
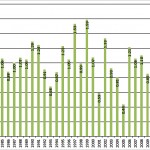
- April First North Cascade Snowpack
-
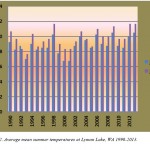
- Mean Summer temperature at Lyman Lake, WA
-
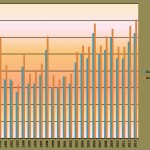
- Mean minimum summer temperature at Lyman Lake, WA
Glacier Mass Balance:
Snow depth was measured at a 30 m spacing across the entire glacier on August 4th. The position of the snowline indicates the location where snow depth is zero. Assessment of stakes emplaced in the glacier from Aug. 3-20 indicates mean ablation during the period of 7.8 cm/day. Assessment of ablation from remapping of the snowline on Sept. 1 indicates mean ablation of 7.5 cm/day during the August 4th-Sept. 1st period. A preliminary map of Sholes Glacier mass balance for Aug. 8th is seen below (Figure 6). The contours are in meters of water equivalent, which is the amount of water thickness that would be generated if the snow or ice was melted. Note the similarity of the 1.75 m contour and the Sept,. 12th snowline.The best measure of ablation over the period from August 4th to Sept. 12th is the shift in the snowline, as identified in satellite imagery (Figure 7 and 8). The snow depth at a particular location of the snowline on Sept. 12th indicates the snow ablation since August 4th. Observations of the snowline margin on Aug. 20, Sept. 1 and Sept. 12 indicated mean ablation of 7.4 cm per day from Aug. 4th to Sept. 12th.
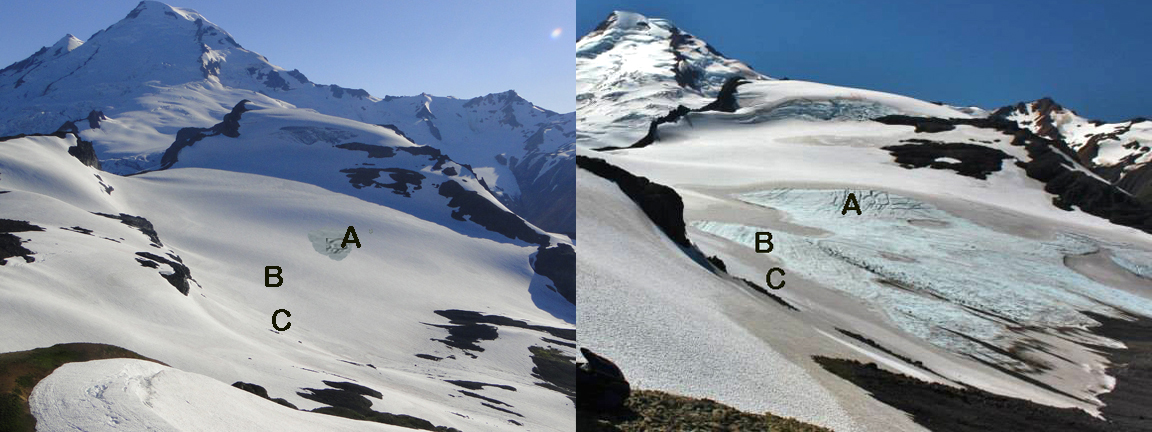
Figure 4 Comparison of snowpack on Sholes Glacier on August 4th and September 1st, 2013
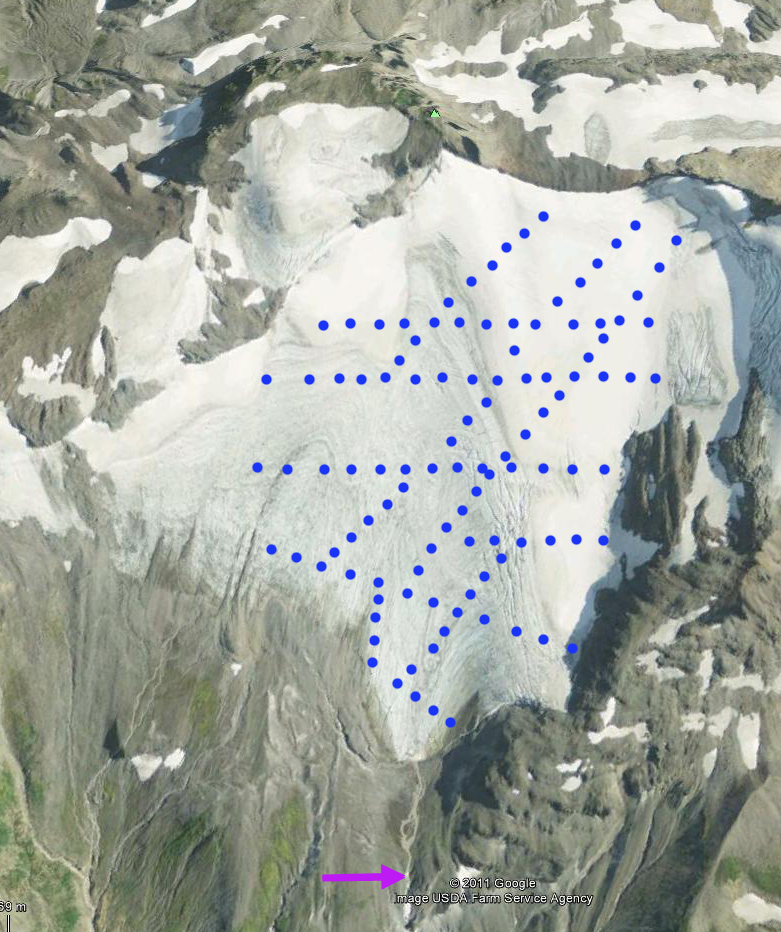
Figure 5. Sholes Glacier snow depth measurement network
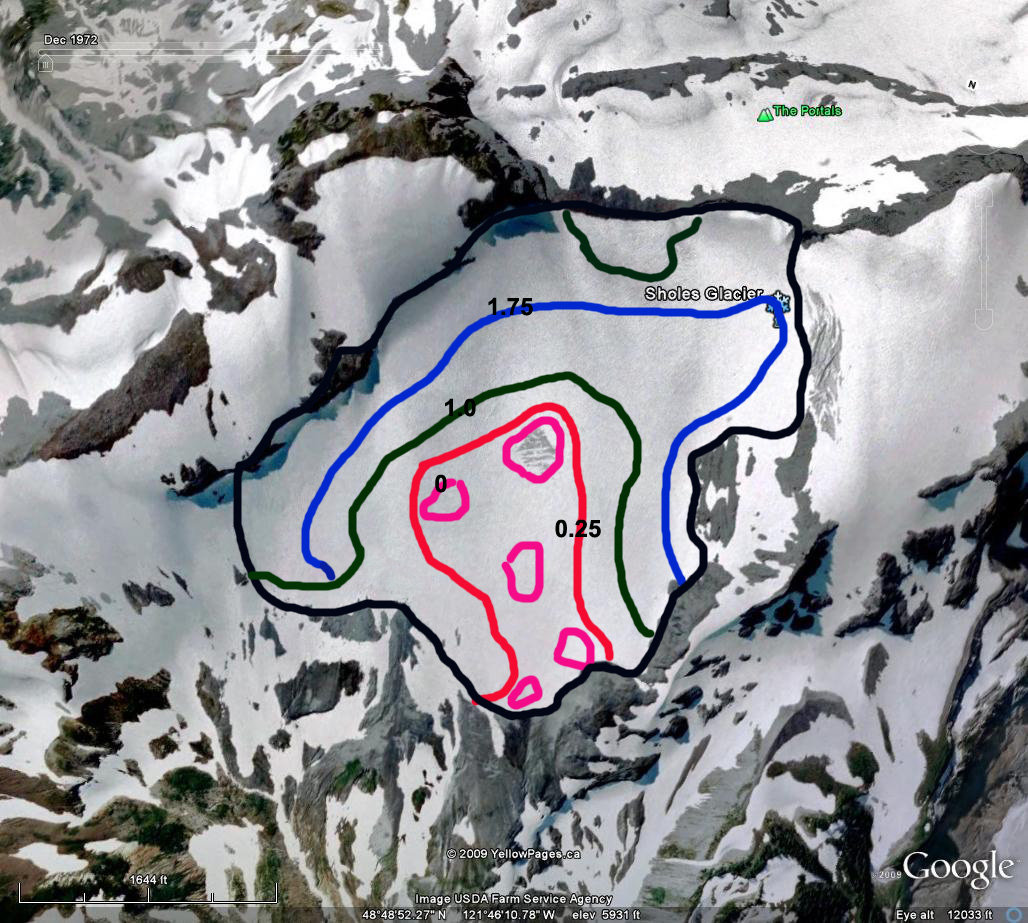
Figure 6. Snow depth distribution in snow water equivalent on Sholes Glacier on Aug. 8th, 2013.

Figure 7 August 4th satellite image showing snowline on Sholes Glacier from Landsat imagery.

Figure 8. September 12 snowline on Sholes Glacier from Landsat imagery
Snow depth observations on Easton Glacier on the bench below the main icefall at 2000 m, yielded an average depth of 3.1 m on Aug. 10th. The bench was completely snowcovered on Aug. 10th. GPS measurements of the snowline on Sept. 15th indicate ablation of 2.75 m since Aug. 10th. This is an ablation rate of 7.6 cm of snow melt per day. This is 0.2 cm/day higher than Sholes Glacier. The time period is not identical either. The southern orientation of Easton Glacier typically leads to higher ablation rates at specific elevations than on Sholes Glacier. Satellite observations of the change in snowline position compared to snow depth observations from Aug. 4th to Sept 12th indicate mean ablation of 7.2-8.0 cm/day.
On the four Mount Baker glaciers a total of 380 snow depth measurements were made on (Figure 9). The initial mass balance assessment is -0.78 m on Columbia Glacier. -1.58 m on Easton Glacier, -0.5 m on Foss Glacier, -0.76 m Ice Worm, -0.85 m on Lower Curtis Glacier, -0.40 m Lynch Glacier, -1.85 m on Rainbow Glacier, -1.7 m on Sholes Glacier and -1.15 m on Yawning Glacier. 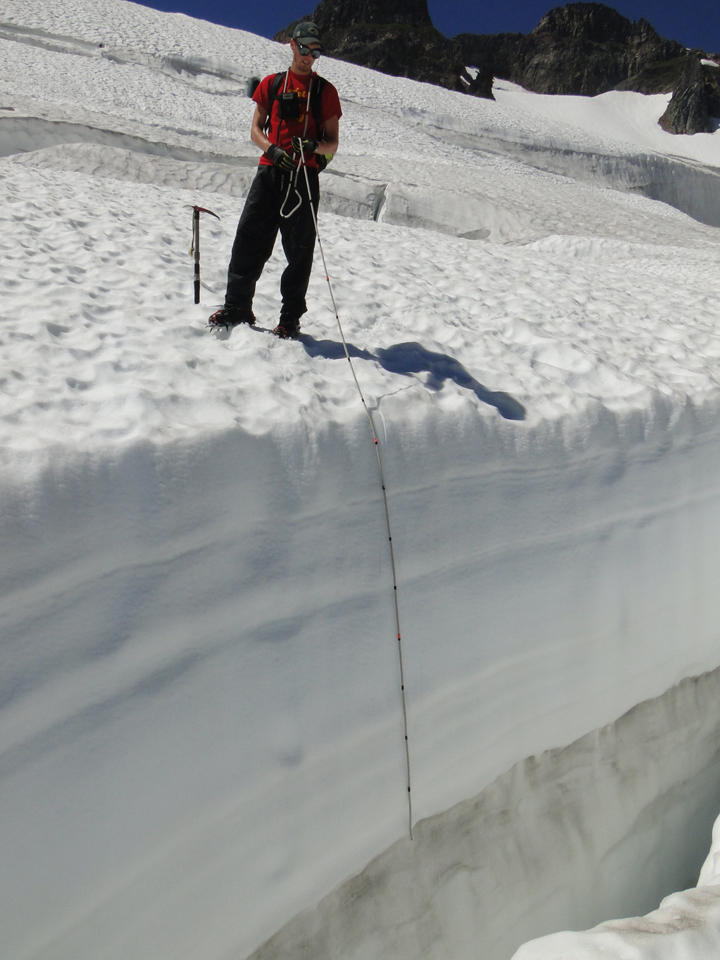
Figure 9 Snow depth in crevasse on Easton Glacier.
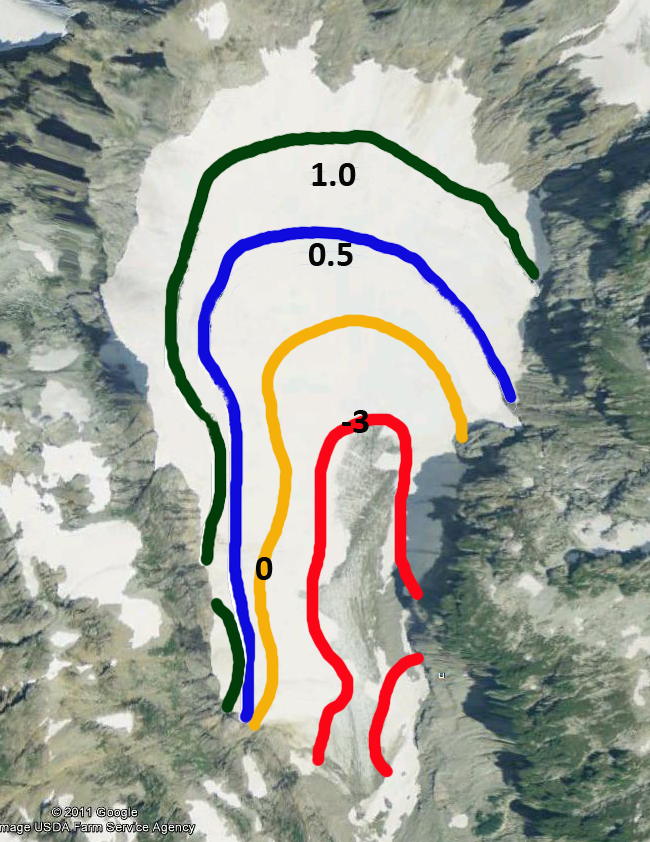
Figure 10 Mass balance map for Columbia Glacier in meters of water equivalent.
On the Juneau Icefield in southeast Alaska the ablation season was warmer and longer than normal. The result was snowlines rising above average at Lemon Creek and Taku Glacier, where the Juneau Icefield Research Program measures mass balance. For Taku Glacier the ELA was 1050 m, 75 m above an equilibrium snowline, and 1115 m, 100 m above an equilibrium snowline for Lemon Creek Glacier. The final mass balance for these glaciers will be in the -0.5 to -1.0 m range for both. Further north the USGS reports preliminary results, from there two Alaskan benchmark glaciers, which indicate that Gulkana Glacier in the Alaska Range, mass balance was the 5th most negative year. At Wolverine Glacier in the Kenai Mountains mass balance will likely be the most negative on record. In British Columbia both the Helm Glacier and Place Glacier are observed annually for mass balance. On Sept 12, 2013 Landsat imagery indicates limited remaining snowcover on both of these glaciers. The snowline is at 2050 m on Helm Glacier and 2300 m on Place Glacier, red arrows. The snowcovered area is less than 20% on Helm Glacier and 30% on Place Glacier, which will lead to large negative mass balances (Figure 11 and 12). Hence, all 16 glaciers examined here will have significant negative mass balances in 2013.
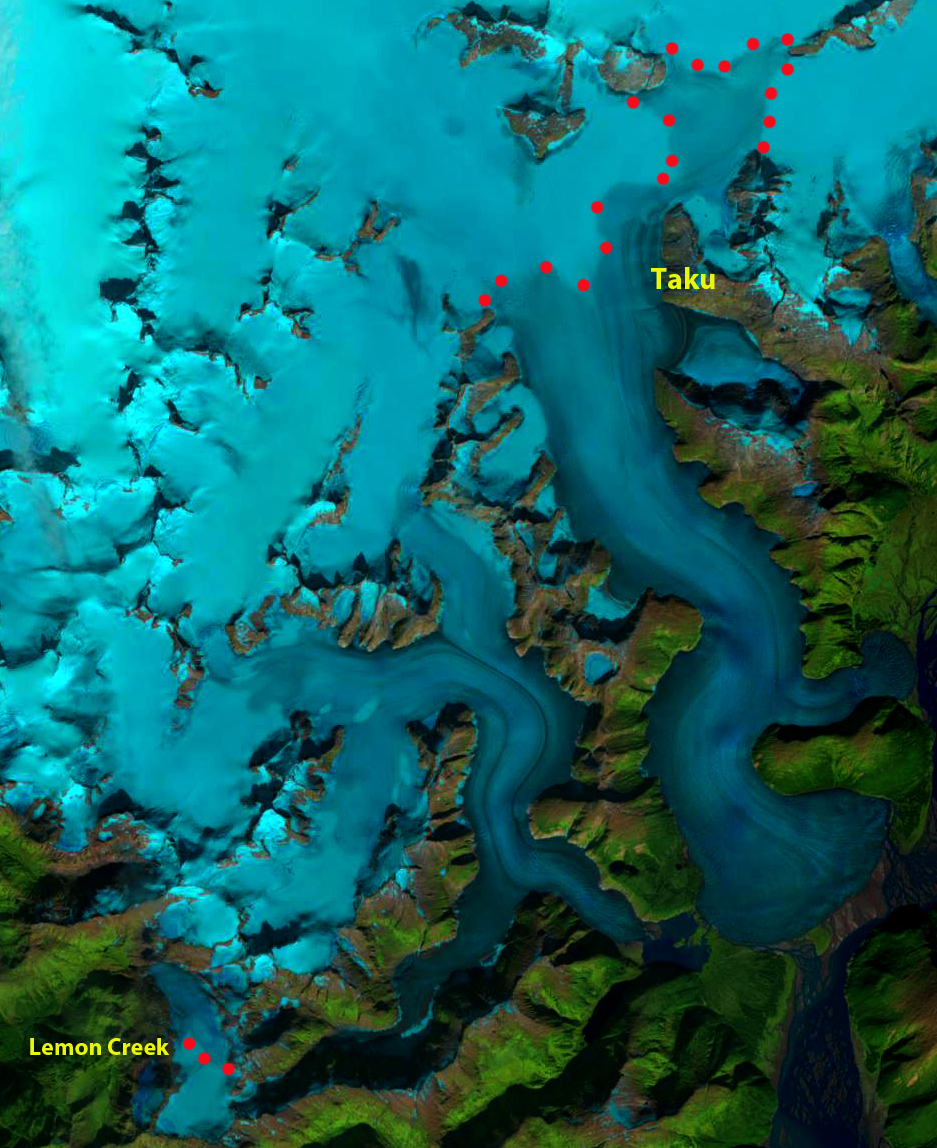
Figure 11. Landsat image indicating the snowline on Sept. 24, 2013 on Lemon Creek and Taku Glacier.
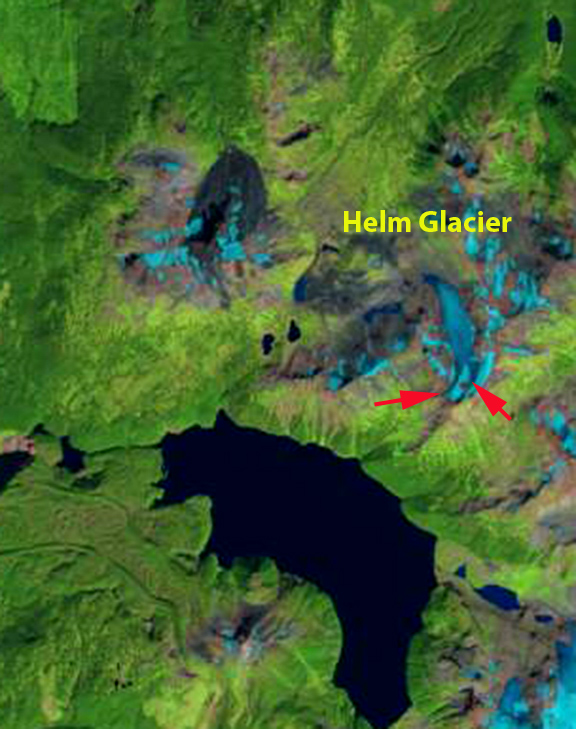
Figure 12 Helm Glacier in Landsat imagery 9-12-2013
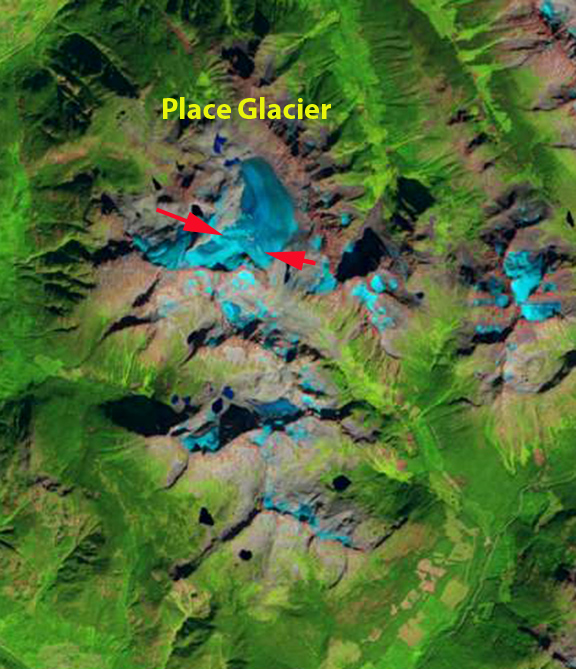
Figure 13 Place Glacier in Landsat imagery 9-12-2013
 Dean of Academic Affairs at Nichols College and Professor of Environmental Science at Nichols College in Massachusetts since 1989. Glaciologist directing the North Cascade Glacier Climate Project since 1984. This project monitors the mass balance and behavior of more glaciers than any other in North America.