
August 27, 2012
Zachariæ Isstrøm Further Retreat, NE Greenland
Posted by Mauri Pelto
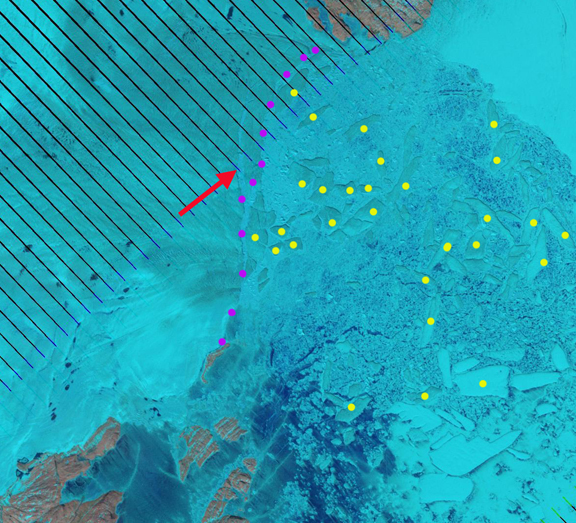
2013 from June 17 Landsat image, yellow dots are icebergs generated in 2012, purple dots terminus, red arrow a rift that will lead to another significant calving event this summer, below this is compared to other images, including from late last summer, when more rifts existed that yielded the icebergs now dotted.
In an article Dan Bailey and I published at Skeptical Science, we observed that in northern Greenland high velocities extend far inland only on Zachariae and Petermann Glacier tapping into the midst of the ice sheet in northern Greenland. Further, it is the Zachariae Isstrøm (ZIS) that is likely the only of this group that would be comparable to a bank that is too big to fail as its increased velocity band extends well into the ice sheet. ZIS is one of the three main outlets of the northeast Greenland Ice Stream, Storstrommen and Nioghalvfjerdsfjorden (79N) are the other two.  The extent of the high velocity zone is evident in the first image below from the exceptionally detailed work of Joughin et al (2010), and Joughin et al (2001). The area of high velocity versus the surrounding ice at over 100 m/year extends 350 km upglacier from the ZIS terminus. The velocity then increased from 100 to 400+ m/year from 200-100 km from the ice front. At the grounding line the velocity is 1100 m/year (Rignot et al, 2001). The velocity remains high to the ZIS icefront. The width of the ice stream identified by the zone of higher flow is 40 km wide 350 km above the terminus and remains at least 30 km wide all the way to the terminus region. The velocity is lower than on Jakobshavns, but the ice stream is also much wider.
A view of the basal topography from Joughin et al (2001) indicates that the acceleration occurs in the same area as the bed depth drops significantly below sea level 200 km from the ice front. The base of the glacier is 300-700 meters below sea level all the way to the ice front. The thickness at the grounding line is noted as 550-600 meters by Rignot et al (2001). The result is an ice flux at the grounding line of ZIS of some 11 cubic kilometers per year, this is much less than the 40+ cubic kilometers from Jakobshavn Isbrae and similar to the 12 cubic kilometers from Petermann Glacier. The red arrows in both images indicates the area of fast ice, discussed below and the yellow arrow the location of the new 2012 ice front.


This post examines recent changes in ZIS updating the work of Box and Decker (2011). They noted an average decadal rate of loss of 14 square kilometers/year and the evolving terminus position in the first image below from Jason Box at Meltfactor.org. Box and Decker (2011) also noted a potential advance in 2006-2007, that we will further explore here.  The reduced sea ice in the region has exposed the ZIS terminus to increased open water in what was typically a region that was dominated by persistent sea ice. The enhanced surface melting is also a concern. In 2012 ZIS has experienced an additional retreat that has separated the main glacier from a melange of glacier ice and fast sea ice on the northeast side of the terminus, that had survived the last major tongue disintegration of the southern floating arm of ZIS in 2000-2001. The changes have been an going watch by several of the participants at the Arctic Sea Ice blog, which has developed into a wonderful community for daily detailed sea ice observations. Espen Olesen and I have discussed the split that occurred this August which warrants pointing out and. Here we examine Landsat imagery from 2006, 2008, 2009 and 2010 and MODIS imagery from 2011 and Aug. 19 2012 to depict the changes. The last image is a July 30 2012 Landsat with the purple terminus line indicated. The images are shown below with the fast ice zone (FI) noted in 2006 and the MODIS images from 2011 and 2012. The new 2012 terminus that has retreated to the corner of Lambert land, or Kap Zacharaiae is indicated by a yellow arrow, this is Kap Zachariae, and is separate from the ice to the northeast. The actual terminus in the Landsat images is indicated by purple dots, but based on the melange that exists on the east side and fast ice on the north side this is not a clear cut distinction. The fast ice is distorted in a convex pattern by the impinging ice front in the Landsat images. The new terminus is at the southeast corner of Lambert land and extends directly southwest to Heretugen Land and then Norreland
2006 Landsat image

2008 Landsat image
2009 Landsat image

2010 Landsat image

2011 MODIS image

2012 MODIS image
2012 Landsat image
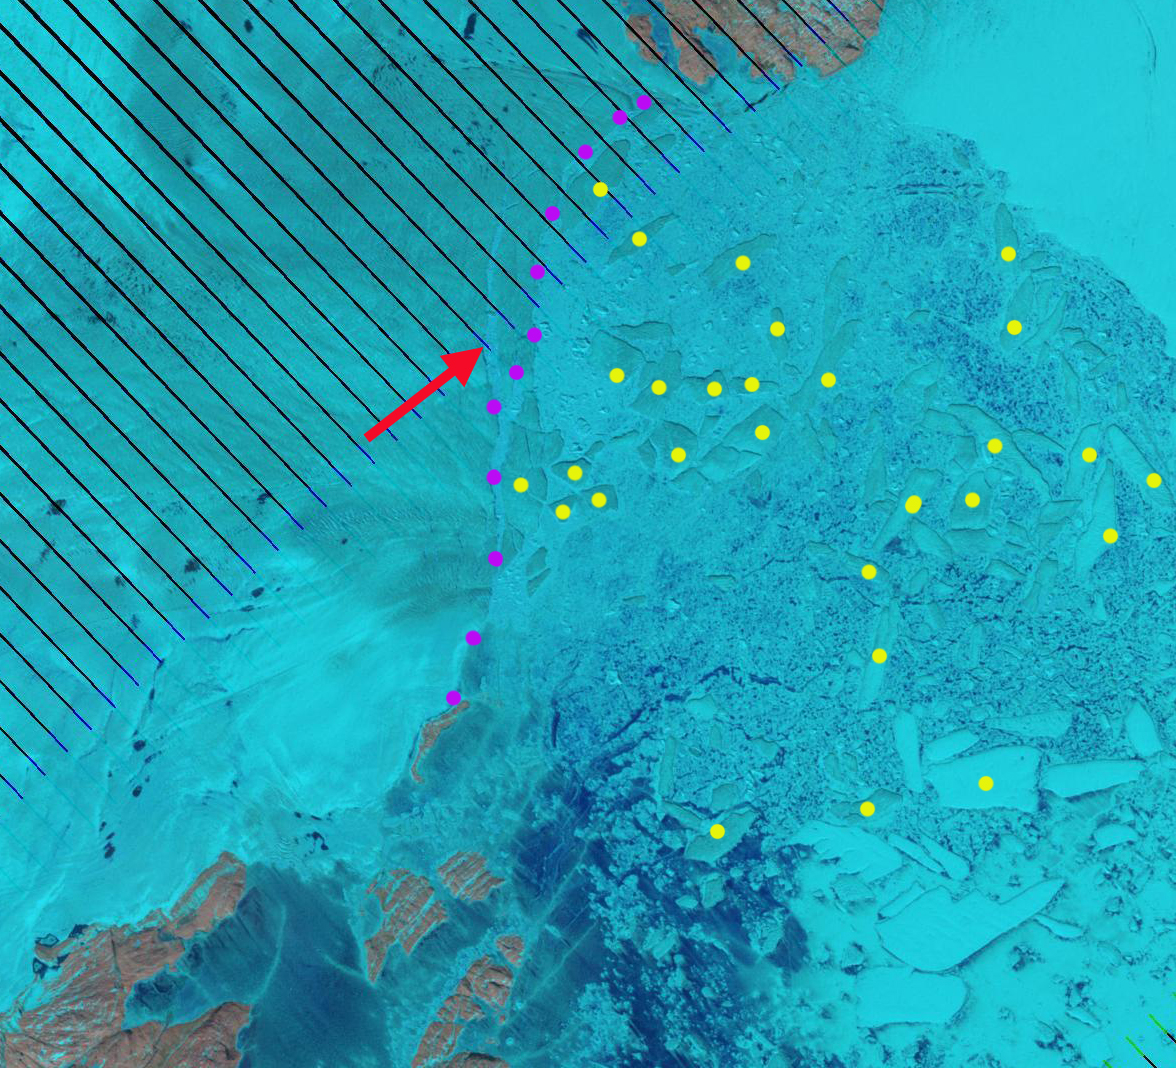
2013 from June 17 Landsat image, yellow dots are icebergs, purple dots terminus, red arrow a rift that will lead to another significant calving event this summer.
The retreat follows the calving events on Petermann and Steesnby Glacier. Here there is no single large iceberg to observe. The retreat from 2010 to 2012 is approximately 10 km, the loss of area is particularly hard to accurately determine. Overlaying the 2006 and 2012 images I estimate the loss at 170 km2. The ice margin in 2000-2001 is even harder to accurately depict. Most maps and analysis to date have included much of the fast sea ice as part of the glacier. The fast ice has a velocity unconformity with the main ice and a profile that is not consistent with it being connected to ZIS. Whether it is fast sea ice or a combination of relict ice from ZIS and fast ice is unclear. Here based on the same assessment as used for the other years the retreat from 2001-2012 amount to the loss of 600 km2, most of which occurred abruptly in 2000-2001. The changes are seen in the composite below of two 2001 images, with the yellow being the tentative 2001 margin, green the 2006 margin and red the 2012 margin. A closeup of the area just south of Kap Zachariae indicates the change from 2006 on right to 2012 on left from an unrifted main outlet of ZIS, to an area of scattered ice bergs with rifts developing further west as well. This image from July 30, had turned to open water two weeks later. As of Sept. 2, 2012 there is still considerable open water in the embayment around ZIS, bottom image.


 Dean of Academic Affairs at Nichols College and Professor of Environmental Science at Nichols College in Massachusetts since 1989. Glaciologist directing the North Cascade Glacier Climate Project since 1984. This project monitors the mass balance and behavior of more glaciers than any other in North America.