November 15, 2010
North Cascade Glacier Mass Balance 2010
Posted by Mauri Pelto
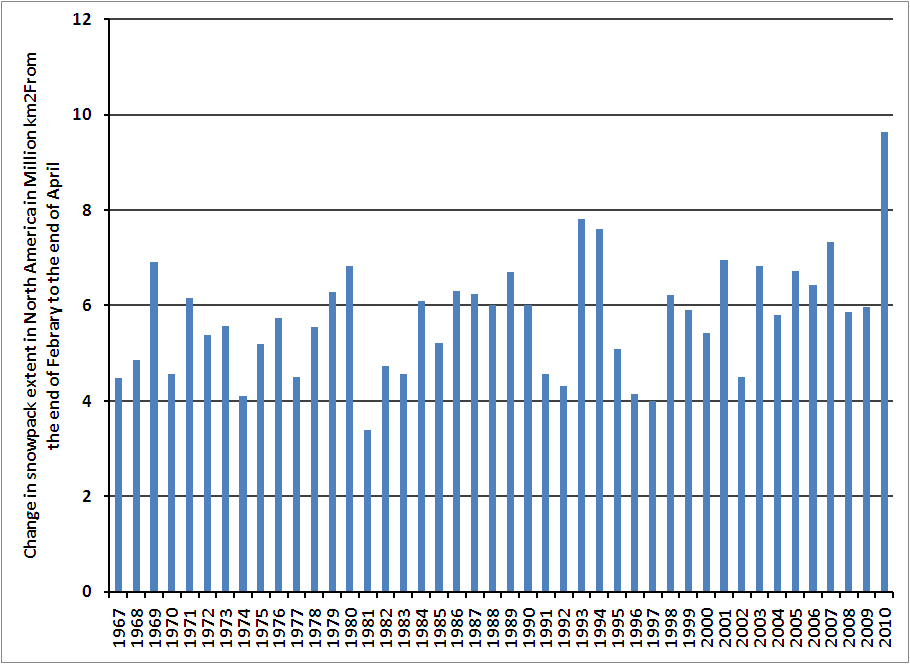
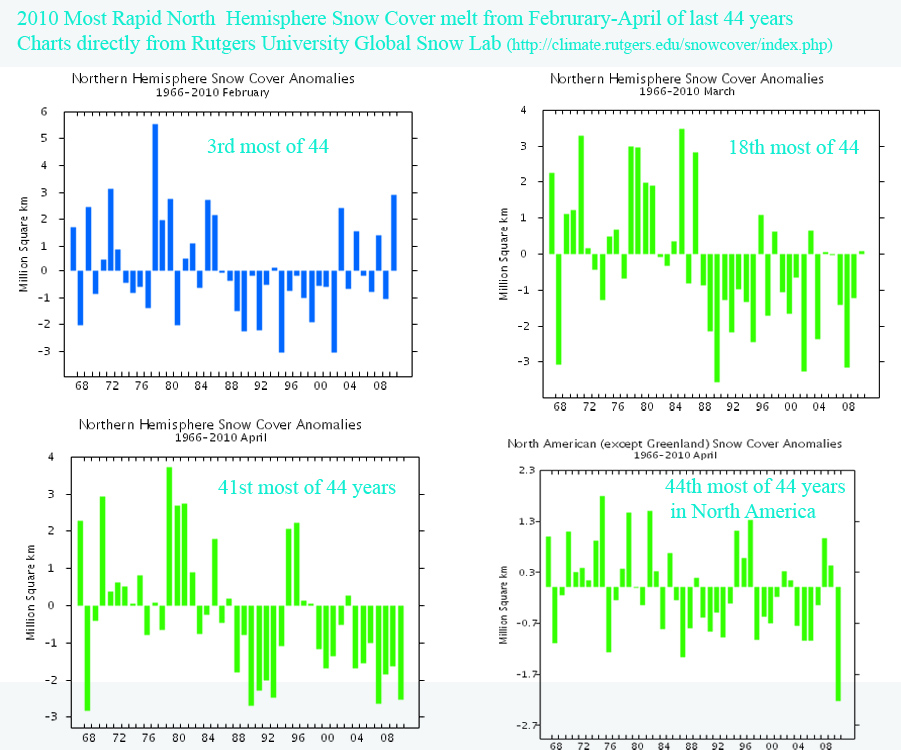
 A glacier has no memory of the past year when it comes to mass balance, unlike say the extent of sea ice, it is more like the extent of snowcover. This was emphasized by a comparison of glacier mass balance in the North Cascades from 2009 to 2010. Temperature sensitivity is also highest during the summer for a glacier and for snowcover in general. As the melt season begins the snow cover extent is large on a glacier-100% for North Cascade glaciers. The key is how rapidly the snow line rises during the melt season. For continental scale snowcover it is more of a recession northward. In the Northern Hemisphere for example February 2010 was the third most extensive snow cover extent of the last 44 years, March the 18th of the last 44 years, and April the 41st most of the last 44 years, in the Northern Hemisphere and the 44th most extensive in North America. (Rutgers University Global Snow Lab). This change indicates a record snow cover melt off in 2010 for the last 44 years. This was not surprising given that global temperatures anomalies were also at there highest levels during this period. This can happen on a glacier as well.
 For North America the main change with global warming is the decrease in melt season snow cover extent as noted in the image below, which shows red for well below average snowpack, and dark blue well above average snowpack. Note the dark blue nature of summer in the 1970’s and the dark red in the summers after 2003. t is during the summer when temperature alone is the key, not storm tracks and jet stream position.
  . For the North Cascades the summer melt season of 2009 was the record, not 2010. North Cascade glaciers over the 27 years I have been monitoring them. I
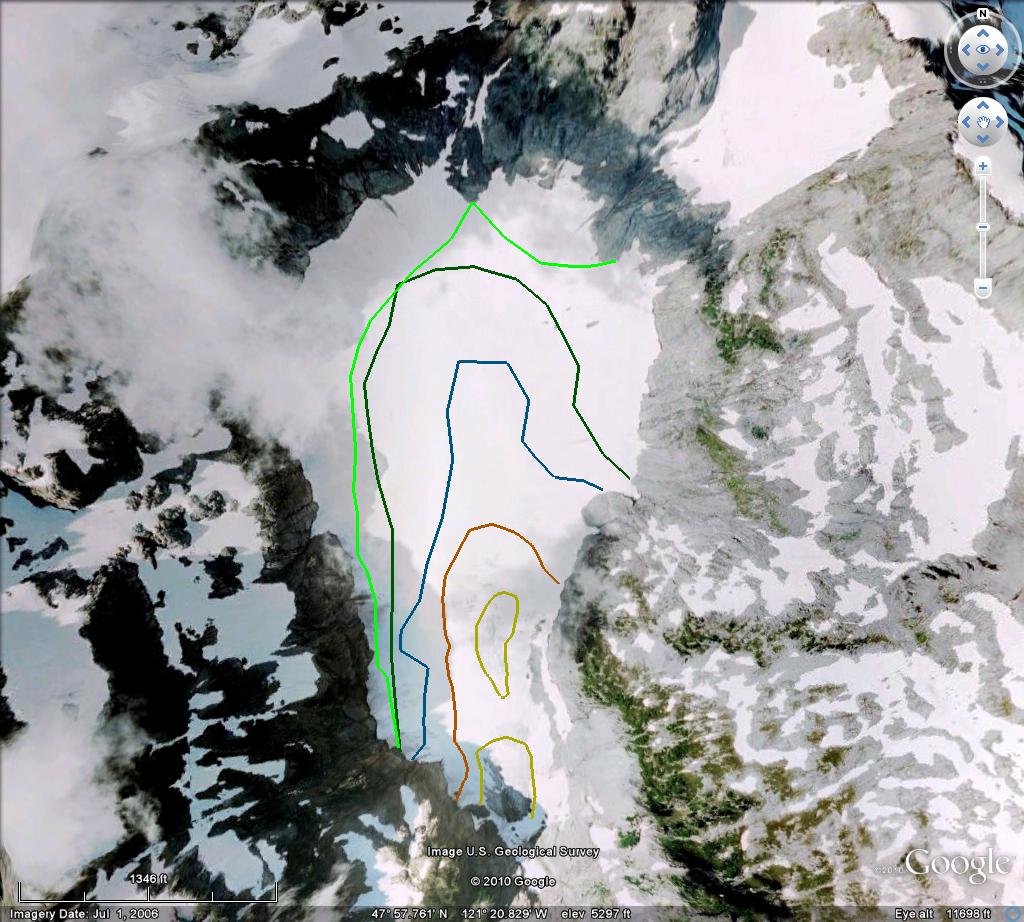
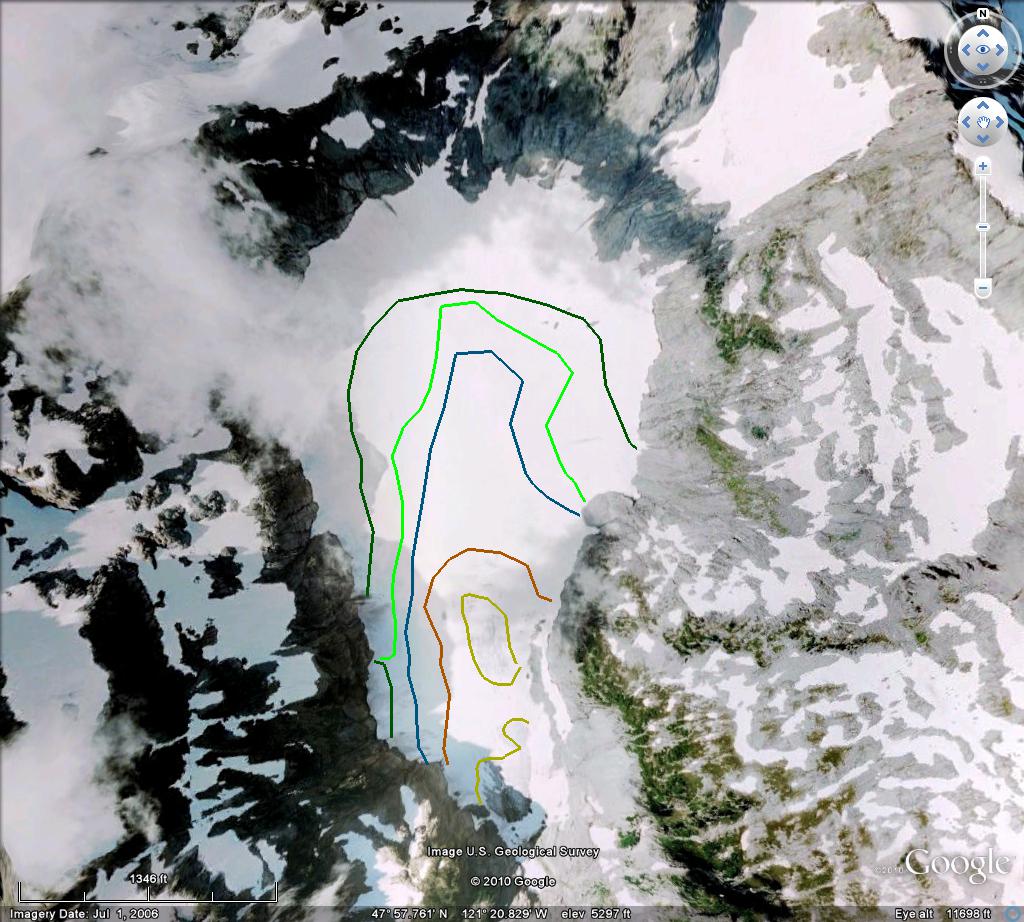
For the North Cascades In 2009 a negative PDO (Pacific Decadal Oscillation) and negative ENSO (La Nina) existed leading to below normal temperatures and average precipitation during the winter in the Pacific Northwest. The combination of a negative PDO and a negative or equilibrium La Nina has led to an equilibrium or positive glacier mass balance in the North Cascades, WA in 13 of 16 years since 1960. The summer of 2009 had the highest total ablation recorded during annual mass balance measurements since 1984, offsetting good winter snowpack and leading to a mean negative mass balance of -1.9 m. In 2010 a positive PDO and ENSO (El Nino) conditions persisted during the winter leading to above normal temperatures and average precipitation in the Pacific Northwest. The combination of a positive PDO and El Nino has led to negative glacier balance in all 14 years this has occurred since 1960. A markedly cool 2010 melt season led to near minimum ablation since 1984, and an equilibrium mean annual balance of 0.05 m. Ablation season conditions dominated the mass balance record for both years. In 2009 there was a transition from a La Nina to an El Nino accompanied by a change to a postiive PDO. In 2010 a change from an El Nino to a La Nina and to a negative PDO. We will be exploring the impact of coastal upwelling strength, upwelling onset, PDO, ENSO and the Pacific Transition for these two unusual summer seasons. In 2009 a high pressure ridge was centered over the West Coast, upwelling began early and there was limited marine influence along the coast. In 2010 an anomalous high pressure center in the eastern North Pacific generated northerly winds along the West Coast and a late onset of upwelling. Our goal is to be able to forecast the summer melt season conditions sometime in May. A comparison of the mass balance maps for Columbia Glacier in 2009 and 2010 illustrates the difference
 The lines are contours of mass balance ochre is the zero balance line as of August 1, then brown-red 1 m of snowpack, blue, two meters and green three meters, than lime green is the end of summer snow line. Note that as of Aug. 1 both years had nearly identical snowpack, but ablation was much higher due to record warmth in August 2009, and the snowline ended much higher than in 2010. The result despite less winter snowpack, a more positive though still negative mass balance for Columbia Glacier in 2010. In the summer of 2010 we measured the snow depth and/or snow melt at 180 locations on this glacier. The Columbia Glacier is a low elevation glacier mostly below 5200 feet. It is also avalanche fed. Both factors led to abnormally low snow accumulation in the winter of 2010, and despite the cool summer a negative balance. Easton Glacier on Mount Baker on the other hand is mostly above 6000 feet, and does not receive avalanche accumulation. The winter snowpack was close to normal and then below normal melting led to a positive mass balance. The glacier gained an average thickness of 0.7 meters. This is small compared to the loss of 2 meters.


 Dean of Academic Affairs at Nichols College and Professor of Environmental Science at Nichols College in Massachusetts since 1989. Glaciologist directing the North Cascade Glacier Climate Project since 1984. This project monitors the mass balance and behavior of more glaciers than any other in North America.