April 15, 2010
North Cascade Glacier 2010 Mass Balance Forecast
Posted by Mauri Pelto
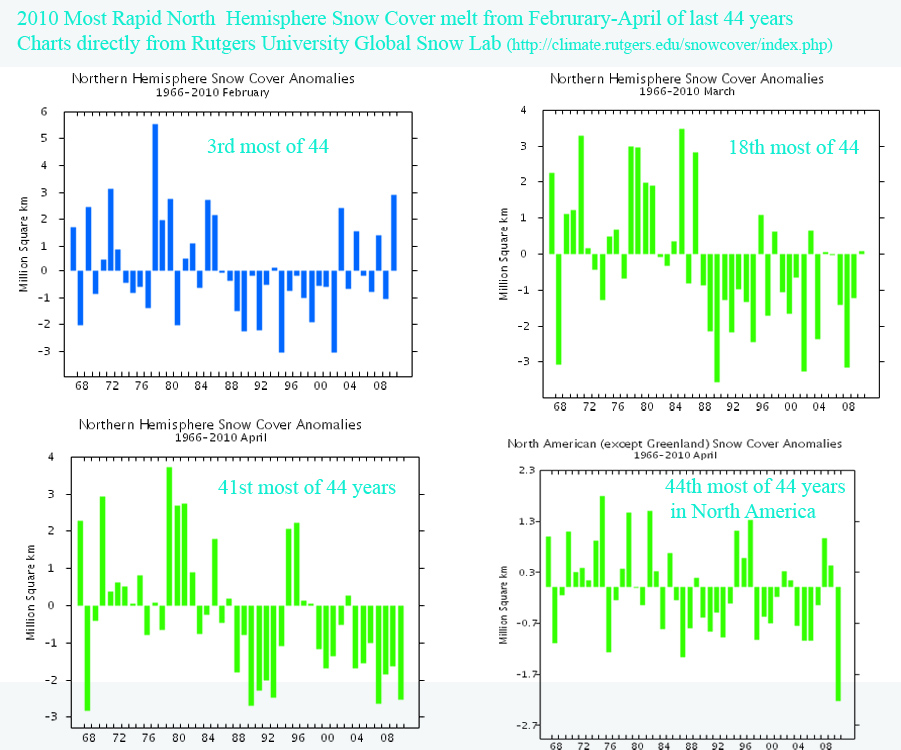
Beginning in 2006 the North Cascade Glacier Climate Project began to forecast glacier mass balance from atmospheric circulation index data. To be useful for water resource managers such a forecast must be made early in the spring. This is when snowpack begins melting at elevations below the glaciers and reservoirs can begin to be recharged. A first generation forecasting model that relied on October-March Pacific Decadal Oscillation and El Nino Southern Oscillation Index values was developed. The mass balance forecast method reliably determined if the mass balance of North Cascade glaciers would be negative, equilibrium or positive in 22 of the last 26 years. Most people may be under the impression that the snowmelt season is well underway, in fact 2010 has seen a record loss of snowpack extent through March this year in North America. A look at the snow cover depletion using data from the Rutgers Global Snow Lab beginning in either the 7th, 8th or 9th week and ending with the 14th week indicates this record melt. In the second image the rapid snow cover loss is further apparent. In the Northern Hemisphere for example February 2010 was the third most extensive snow cover extent of the last 44 years, March the 18th of the last 44 years, and April the 41st most of the last 44 years (Rutgers University Global Snow Lab). This change indicates a record snow cover melt off in 2010 for the last 44 years. This can happen on a glacier as well.
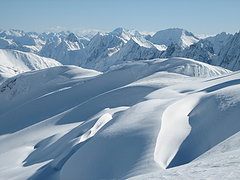
 However, for glaciers the snowmelt season usually ends close to May 1. The melt season in the North Cascades is still not upon us. Typical maximum accumulation occurs around May 10.
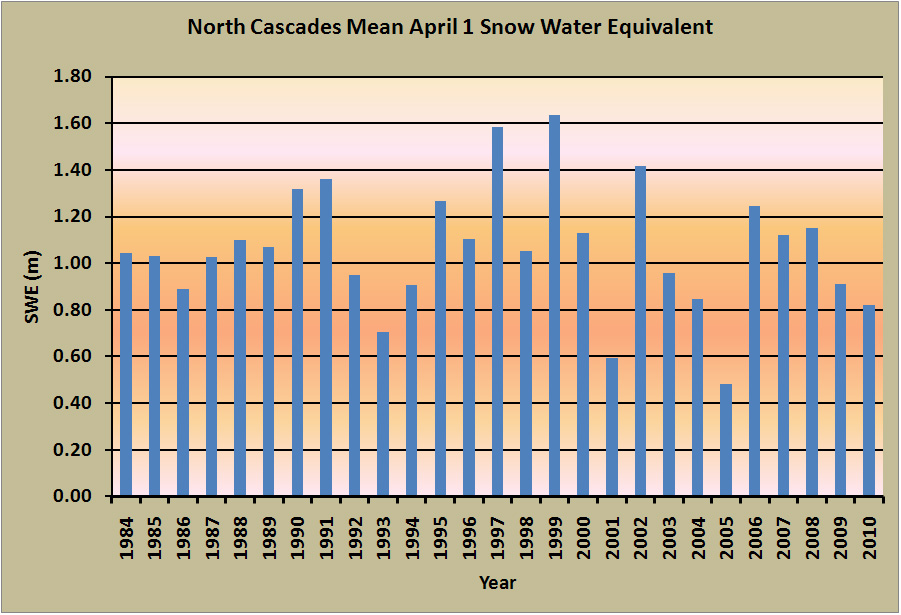
  The best long term snowpack data is for April 1, hence that date is often used to evaluate the end of winter snowpack for snow measurement stations most of which are well below glacier elevations. This year snowpack on April 1 averaged 0.82 meters. There has been no year with positive mass balance and snowpack on April 1 below 1.0 meters.
  If we look solely at the indices both PDO and ENSO had positive values this winter. This is similar to the case in 1987, 1993, 1994, 1995, 1998, 2003, 2004,and 2005 all negative balance years.
 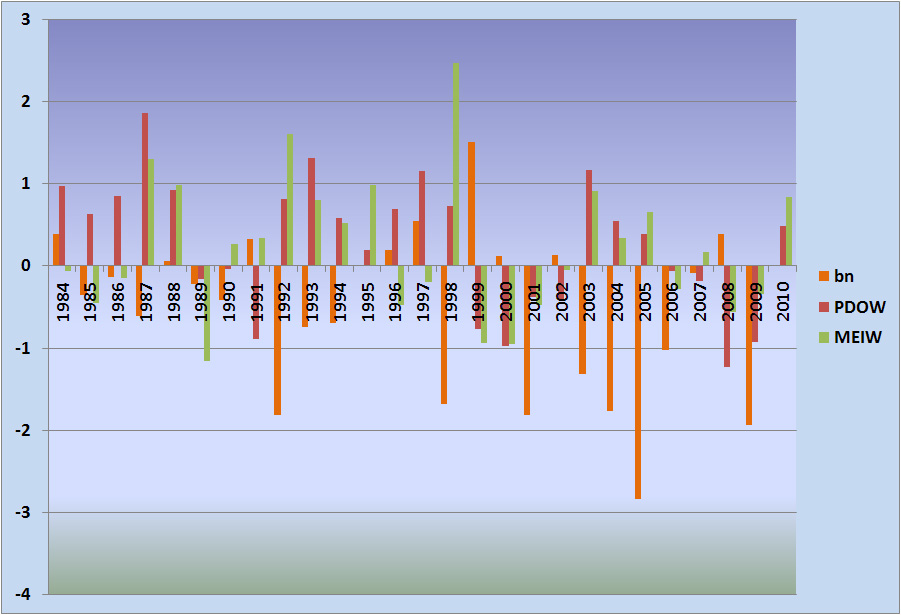 The rule for the model is that if PDO and ENSO are positive glacier mass balance will be negative. Both of the indices reflect sea surface temperature in the Pacific, and positive values favor warmer SST’s near the west coast. Lastly we have the temperature forecast from NOAA for spring which for the area shows a high degree of confidence for above normal temperatures from April-June.
 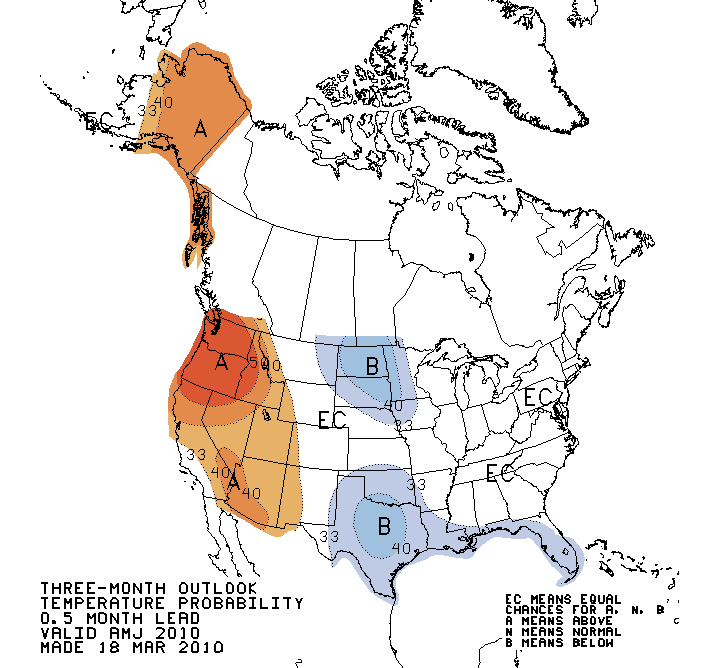 All of the above indicate glacier mass balance will be negative in the North Cascades this year even though the galciers are deeply buried in snow right now.


 Dean of Academic Affairs at Nichols College and Professor of Environmental Science at Nichols College in Massachusetts since 1989. Glaciologist directing the North Cascade Glacier Climate Project since 1984. This project monitors the mass balance and behavior of more glaciers than any other in North America.